
☰ All tutorials
Start here
Tool tutorialsHow to trade with ChartMineStocks
Stock monitorMy watchlistStock scores & checklistMarket & sectors
Nifty 50Bank NiftySensexFin NiftyDaily market reportMarket breadthSector rotationSector heatmapStock screenerRelative strength (RS)MCX commodity pricesFear & Greed IndexWhat happens after…Scanners
Top gainers & losersStocks to watch tomorrowNR7 stocks scannerInside bar stocks52-week high stocksGap up & gap down stocksRSI oversold stocksGolden cross stocksSuperTrend buy stocksScan builderEMA 9/21 crossoverMACD crossoverADX strong trendBollinger breakout / squeezeVolume spike stocksOpen = high / open = lowCandlestick pattern scannerNarrow CPR scannerF&O data
F&O ban listOI build-upOption chainPCR & max painExpiry calendarF&O lot sizesOI build-up heatmapPCR trendMax pain trendFutures basisStock screens
Quarterly growersProfit growth stocksLow P/E stocksMutual fund buyingNear 52-week low, growingDebt-free companiesHigh ROE & ROCEMagic Formula stocksLow price-to-bookSmart money
FII / DII dataShareholding changesBig-money footprintShort selling dataF&O positions by participantBulk & block dealsPromoter buyingDelivery percentageCalendars
Results calendarQuarterly results trackerBoard meetingsCorporate actionsIPO calendarIPO performanceResearch & planning
Strategy testerCompare stocksDividend yield stocksASM / GSM listExpiry-day movesSeasonality & stock historyNSE holidays 2026Position size calculatorOption payoff calculatorPivot point calculatorMore
Stock scanners hubStock screensHow to use the Narrow CPR scanner
A complete, plain-language tutorial on the Central Pivot Range: what it is, how it is calculated, the types of CPR, what our own data says about it, how to read every part of the scanner, and three playbooks with real case studies.
What the CPR is, in plain words
Every trading day leaves a footprint: a high, a low and a closing price. The Central Pivot Range (CPR) turns yesterday’s footprint into three price levels for today. Think of it as the market’s “fair value zone” for the new day: the area around which buyers and sellers last agreed.
The three levels are:
- Pivot (P): the average of yesterday’s high, low and close. The centre of the zone.
- TC (top central) and BC (bottom central): two levels just above and below the pivot. Together they form a band.
When the band is wide, yesterday’s price swung a lot and closed somewhere in the middle; the market is often calm, sideways and choppy the next day. When the band is narrow, buyers and sellers were in tight balance; traders watch these days because balance often breaks into a strong one-directional (trending) day.
One line to remember: the CPR tells you where the important prices are today and what kind of day it might be. It does not tell you which way the price will go.
The Narrow CPR scanner calculates tomorrow’s CPR for every F&O stock and the main indices after each close, and ranks them from the tightest band to the widest, so you start the evening with a ready shortlist instead of checking 200 charts by hand.
How the CPR is calculated (with a real example)
You never need to calculate it yourself (the scanner does it), but knowing the arithmetic makes the levels feel less like magic.
| Level | Formula |
|---|---|
| Pivot (P) | (High + Low + Close) ÷ 3 |
| BC | (High + Low) ÷ 2 |
| TC | (P − BC) + P |
| R1 (first resistance) | 2 × P − Low |
| S1 (first support) | 2 × P − High |
| CPR width | (TC − BC) ÷ Close, as a % |
Example 1: SBIN on a normal day (Friday 6 Nov 2026)
SBIN traded between ₹990.50 and ₹1,020.00 and closed at ₹1,018.50.
- P = (1,020 + 990.50 + 1,018.50) ÷ 3 = ₹1,009.67
- BC = (1,020 + 990.50) ÷ 2 = ₹1,005.25
- TC = (1,009.67 − 1,005.25) + 1,009.67 = ₹1,014.08
- Width = (1,014.08 − 1,005.25) ÷ 1,018.50 = 0.87%: a wide CPR. SBIN would not appear in the narrow list.
Example 2: SBIN after the one-hour Muhurat session (Sunday 8 Nov 2026)
In the short Diwali session SBIN only moved between ₹1,015.10 and ₹1,025.00 and closed at ₹1,016.00.
- P = ₹1,018.70, BC = ₹1,020.05, TC = ₹1,017.35
- Width = 2.70 ÷ 1,016 = 0.27%: narrow.
Two lessons from this example. First, TC came out below BC. That happens whenever the close is in the lower half of the day’s range; it is normal. The top of the band is simply the higher of the two numbers. Second, a very short session (like Muhurat) makes almost every stock’s CPR narrow. On 9 Nov 2026 the scanner listed 219 of 239 instruments as narrow; that was the short session, not 219 real setups.
Types of CPR you will see
Traders describe the CPR in a few standard ways. The scanner labels the first group for you; the others you read from the chart.
By width (the scanner’s “Type” column)
| Type | Width | What it usually means |
|---|---|---|
| 🔥 Extreme | 0.05% or less | Yesterday closed almost exactly at its midpoint. Perfect balance. The tightest, rarest setups. |
| Ultra narrow | 0.05% to 0.15% | Very tight balance. Watched for a breakout. |
| Narrow | 0.15% to 0.30% | Tight. The most common “narrow CPR” setup. |
| Moderate | 0.30% to 0.50% | Normal. Shown so you can compare. |
| Wide | above 0.50% | Not listed. Often a range-bound, sideways day: the price tends to stay inside or around the band. |
By position (the scanner’s “Trend” column)
- Bullish: today’s close is above tomorrow’s band. Buyers finished in control.
- Bearish: today’s close is below tomorrow’s band. Sellers finished in control.
- Neutral: the close is inside the band.
Virgin CPR (👁)
A virgin CPR is a band that the day’s price never touched: the whole day traded above it or below it. Many traders treat an untouched band as a magnet or a strong support/resistance level for the following sessions. The scanner marks these with 👁 and lets you show only virgin CPRs.
Ascending and descending CPR (read from the chart)
Compare today’s band with yesterday’s. A band that is higher than the previous day’s (ascending) shows value moving up; lower (descending) shows value moving down; overlapping bands show a market that has not decided. Plot a few days of CPR with the pivot point calculator or on your chart to see this.
Why traders watch a narrow CPR: advantages and limits
✅ Ready-made levels
Pivot, TC, BC, R1 and S1 give you objective prices to plan entries, stops and targets before the market opens.
✅ Day-type clue
Wide band: expect a slower, sideways day. Narrow band: be ready for movement. It helps you choose how to trade, not just what.
✅ Saves hours
The scanner checks every F&O stock and index after the close and hands you the tightest ones with trend and OI already attached.
✅ Everyone sees the same levels
The formula is public and widely used, so many traders place orders around the same prices. That is part of why levels react.
The limits (please read this part)
We tested the scanner’s own history: 152 trading days of scans from April to November 2026, about 13,000 stock setups, and checked what each stock did the next day.
| Next day… | Extreme | Narrow | Moderate |
|---|---|---|---|
| Range wider than its own 10-day average | 41% | 40% | 40% |
| Price crossed R1 or S1 during the day | 90% | 90% | 85% |
| Closed in the direction of the “Trend” label | 50% | 56% | 60% |
What this means in plain words:
- A narrow CPR alone did not predict a bigger move in this period. Narrow and moderate setups expanded about equally often.
- The trend label is not a direction call. Extreme setups closed with the trend only half the time, a coin toss.
- R1 and S1 are reached most days (85–90%), so treat them as places the price is likely to visit, not as walls that stop it.
- We also checked whether opening above the band (for bullish) or below it (for bearish) helped. It did not: about 50% either way.
So how should you use it? As a watchlist and a level map. The edge, if any, comes from what you add: waiting for the price to break and hold a level during the day, checking the results calendar and news, sizing small and always using a stop loss. The playbooks below are built that way.
A tour of the scanner screen
Open the Narrow CPR scanner. The page has three parts: the summary at the top, the filters, and the results table.
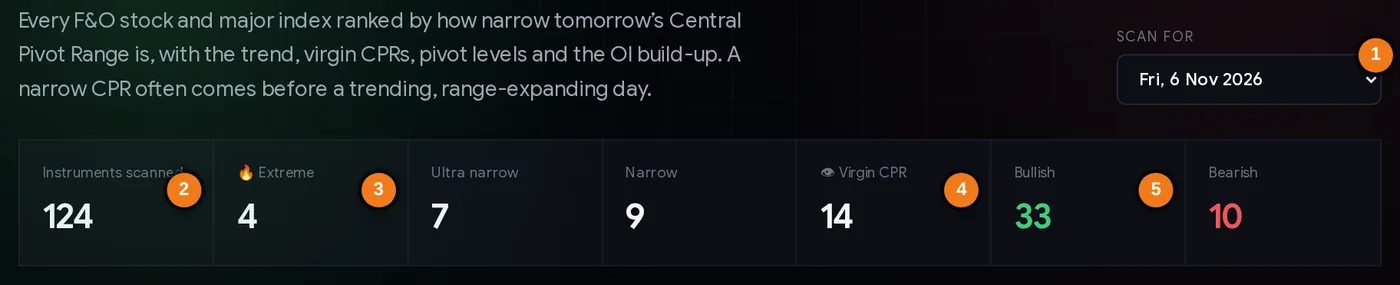
- 1Scan for: pick the scan date. The levels shown are for the next trading day.
- 2Instruments scanned: every F&O stock and the main indices.
- 3Counts by type: Extreme, Ultra narrow, Narrow.
- 4Virgin CPRs in today’s list.
- 5How many setups are bullish and bearish.
The numbers in the summary are counts for the scan you picked. A sudden jump in “Extreme” or “Ultra narrow” across the whole market (as after a short or very quiet session) is a warning that the setups are not special that day.
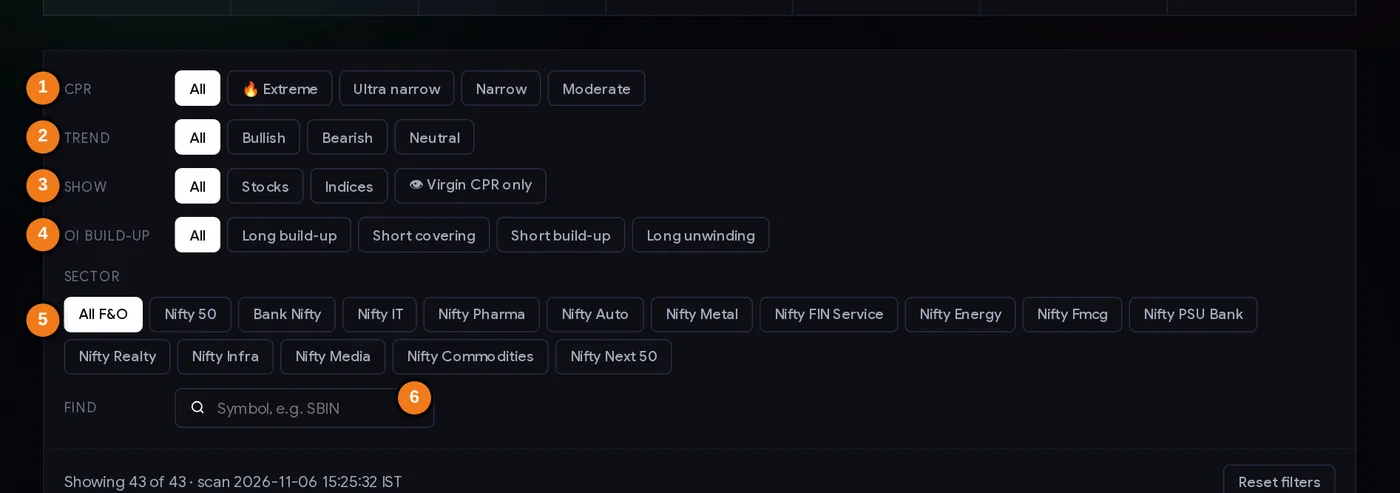
- 1CPR type
- 2Trend
- 3Stocks, indices or virgin CPRs only
- 4Futures OI build-up
- 5Sector
- 6Find a symbol
The filters, from top to bottom
- CPR: show only Extreme, Ultra narrow, Narrow or Moderate.
- Trend: Bullish, Bearish or Neutral.
- Show: stocks, indices, or virgin CPRs only.
- OI build-up: what the futures did today (explained below).
- Sector: limit the list to one index, e.g. Bank Nifty or Nifty IT.
- Find: type a symbol to jump to it. Reset filters clears everything.
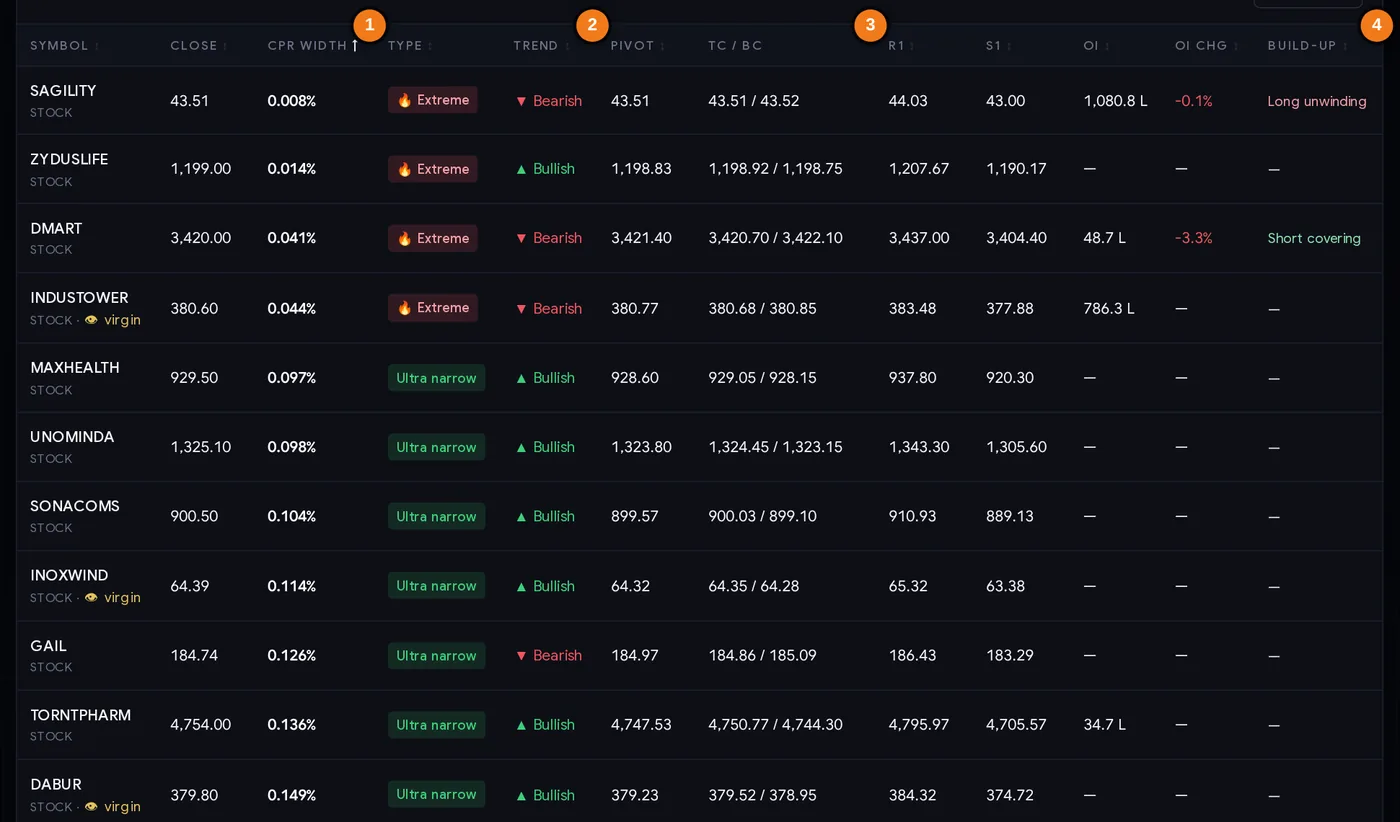
- 1CPR width and type
- 2Trend (close vs tomorrow’s band)
- 3Tomorrow’s band: TC / BC
- 4Futures OI build-up
Every column explained
| Column | What it tells you |
|---|---|
| Symbol | The stock or index. Click to open its ChartMine page. |
| Close | Today’s closing price, the reference for tomorrow. |
| CPR width | Band width as % of price. Smaller = tighter. The table is sorted by this by default; click any column header to sort by it. |
| Type | Extreme / Ultra narrow / Narrow / Moderate, from the width. |
| Trend | Where today closed versus tomorrow’s band: bullish (above), bearish (below), neutral (inside). |
| Pivot | Tomorrow’s central pivot. |
| TC / BC | Tomorrow’s band. Remember: the higher number is the top. |
| R1 / S1 | First resistance above and first support below. |
| OI / OI chg | Open interest in the stock’s futures and today’s change (%). |
| Build-up | Price and OI together: long build-up (price up, OI up), short build-up (price down, OI up), short covering (price up, OI down), long unwinding (price down, OI down). See the OI build-up tutorial. |
Step by step: your evening routine (15 minutes)
- After 3:30 PM, open the scanner. The scan runs at 3:15 PM and is ready by about 3:30 PM. Check the date in the “Scan for” box.
- Glance at the summary. If hundreds of stocks are “narrow”, the day was unusually quiet or short; lower your expectations.
- Filter to Extreme + Ultra narrow. Then pick a sector you follow, or leave “All F&O”.
- Add a trend filter only if it matches the market. If NIFTY itself closed bullish, start with bullish stocks.
- Check the build-up column. A bullish CPR with long build-up means price and fresh futures positions agreed today; a bullish CPR with long unwinding is weaker.
- Remove event risk. Open the results calendar and board meetings. Drop any stock with results tomorrow unless you specifically trade results.
- Shortlist 3 to 5 names and write down for each: TC, BC, R1, S1, your idea (break above / below), and where you would be wrong.
- Mark the levels on your chart before the open, so you react to price instead of calculating during the rush.
Three playbooks
Playbook A: the confirmed breakout (intraday)
- Wait for the first 15–30 minutes. Do nothing at 9:15.
- For a bullish idea, wait for a candle to close above the top of the band (the higher of TC/BC) and, ideally, above R1.
- Enter on that confirmation. Stop loss below the bottom of the band (or below the confirmation candle’s low).
- First target: the next pivot level (R2) or a fixed 1.5–2× your risk. Move the stop to cost once the first target is near.
- Bearish mirror: close below the band and S1, stop above the band.
Playbook B: buy the dip into the band (trend days)
On a bullish setup that opens above the band, the band often acts as support. Wait for the price to pull back into TC/BC and hold (a candle that dips in and closes back above). Enter with a stop just below BC. If the price closes below the whole band, the idea is wrong; exit.
Playbook C: stand aside
Some of the best trades are the ones you skip. Stand aside when: the stock opens far beyond R1 or S1 (the move may already be done), results or big news are due, the whole market’s scan is unusually “narrow”, or the price keeps crossing back and forth through the band in the first hour.
Position size first. Decide how much you are willing to lose on the trade (for example 0.5% of your capital), then use the position size calculator with your entry and stop to get the number of shares or lots.
Case studies from the scanner’s history
Four real setups from 2026, chosen to show the good, the messy and the bad. Prices in ₹.
1. Solar Industries, 13 Aug 2026: the clean breakout
The 12 Aug scan showed an extreme CPR (width 0.014%), trend bullish. Band 18,665 to 18,667.67; R1 18,802.67; S1 18,532.67.
Next day the stock opened at 18,843, already above R1, never came back to the band (low 18,744) and closed at 20,324: +8.5%. The stop for Playbook A (below the band) was never threatened. The company’s results came after the close that day, so part of the move was positioning before the numbers.
2. Federal Bank, 17 Jul 2026: the right idea, a scary path
16 Jul scan: extreme (0.005%), trend bullish. Band 326.98 to 326.99; R1 329.97; S1 324.02.
The stock opened at 328.70, then dipped to 323.40, below S1 and below the band, before rallying to close at 349.00 (+6.9%; high 351). A trader who bought at the open with a stop under the band was stopped out before the big move. A trader who waited for Playbook A’s confirmation could only enter once the price was back above the band and R1 (329.97): later, but still far below the 349 close. The bank’s results were due that evening. Lesson: confirmation beats anticipation; and event days whipsaw.
3. Oil India, 10 Jun 2026: when the label is simply wrong
9 Jun scan: extreme (0.021%), trend bullish. Band 476.30 to 476.40; R1 483.55; S1 469.25.
Next day it opened at 467, already below S1, barely rose (high 467.60) and closed at 427.35: −10.2%. Anyone who bought because the label said “bullish” lost heavily. Lesson: a gap against the setup cancels it. Under Playbook A there was never a bullish entry, and the bearish mirror (close below the band and S1) triggered from the first candle.
4. Bharat Electronics, 28 Jul 2026: the results-day trap
27 Jul scan: extreme, trend bullish, band around 406.5. The company reported results after the close on 27 Jul. On 28 Jul the stock opened at 406.15, inside the band, never traded higher, and closed at 389: −4.5%. Lesson: check the results calendar every evening (step 6 of the routine). The CPR is built from yesterday’s prices; it cannot know about tonight’s numbers.
Common mistakes
- Treating “bullish” as “buy”. It describes where the close was, not where the price will go. Our data: 50% for extreme setups.
- Entering at 9:15. The first minutes are the noisiest. Wait for the band to be tested.
- No stop loss because “it’s a narrow CPR, it must move”. Case 3 fell 10%.
- Ignoring results and news. Cases 2 and 4 were event days.
- Trusting a market-wide “narrow” day, like after Muhurat or a holiday-shortened session.
- Mixing up TC and BC. The top of the band is the higher number, whatever its label.
- Trading too many names. Three well-planned setups beat fifteen rushed ones.
Pre-trade checklist
- Scan date is the latest trading day, and the market-wide count looks normal.
- CPR type is Extreme or Ultra narrow (or Narrow if you want more names).
- Trend label matches NIFTY’s direction; build-up agrees (long build-up for bullish, short build-up for bearish).
- No results, board meeting or big event tomorrow.
- Levels written down: band top, band bottom, R1, S1.
- Entry only after confirmation (a close beyond the band in your direction).
- Stop loss and position size decided before entry.
- Skip if it opens far beyond R1/S1 or chops through the band in the first hour.
Glossary
| CPR | Central Pivot Range: pivot, TC and BC from the previous day’s high, low and close. |
| Pivot (P) | (High + Low + Close) ÷ 3. |
| TC / BC | Top and bottom central levels; the higher one is the top of the band. |
| R1 / S1 | First resistance (2P − Low) and first support (2P − High). |
| CPR width | (TC − BC) ÷ close, in %. |
| Virgin CPR | A band the day’s price never touched. |
| Open interest (OI) | The number of futures contracts still open. Rising OI = new positions. |
| Build-up | The combination of price change and OI change (long build-up, short build-up, short covering, long unwinding). |
| Confirmation | Waiting for a candle to close beyond a level before acting. |
Questions
What is a narrow CPR in trading?
A Central Pivot Range whose top and bottom are very close together, usually under 0.3% of the price. It means the previous day closed near the middle of its range, a sign of balance between buyers and sellers. Traders watch it as a possible sign of a trending day, but in ChartMine’s 152-day study a narrow CPR on its own did not make a bigger move more likely.
When is the narrow CPR scanner updated?
Every trading day: the scan runs at 3:15 PM and is ready by about 3:30 PM IST, with the levels for the next trading day.
Is a narrow CPR a buy signal?
No. It is a setup to watch. The trend label only says whether the stock closed above or below tomorrow’s band; in our data extreme setups closed in that direction about half the time. Wait for price confirmation and use a stop loss.
Why is TC sometimes lower than BC?
When the close is in the lower half of the day’s range, the formula puts TC below BC. It is normal. Treat the higher number as the top of the band and the lower as the bottom.
What is a virgin CPR?
A CPR band that the day’s price never touched, because the whole session traded above or below it. Many traders treat it as a strong level in the following days. The scanner marks it with 👁.
Which timeframe does the CPR use?
The scanner uses the daily CPR: built from the previous day’s high, low and close, for intraday trading the next day. Weekly and monthly CPRs exist for swing trading and can be calculated with the pivot point calculator.
Why did almost every stock show a narrow CPR after Muhurat trading?
The Muhurat session lasts about an hour, so each stock’s high and low are very close together and the CPR comes out narrow for nearly everyone. Treat such days as unusual.