
☰ All tutorials
Start here
Tool tutorialsHow to trade with ChartMineStocks
Stock monitorMy watchlistStock scores & checklistMarket & sectors
Nifty 50Bank NiftySensexFin NiftyDaily market reportMarket breadthSector rotationSector heatmapStock screenerRelative strength (RS)MCX commodity pricesFear & Greed IndexWhat happens after…Scanners
Top gainers & losersStocks to watch tomorrowNR7 stocks scannerInside bar stocks52-week high stocksGap up & gap down stocksRSI oversold stocksGolden cross stocksSuperTrend buy stocksScan builderEMA 9/21 crossoverMACD crossoverADX strong trendBollinger breakout / squeezeVolume spike stocksOpen = high / open = lowCandlestick pattern scannerNarrow CPR scannerF&O data
F&O ban listOI build-upOption chainPCR & max painExpiry calendarF&O lot sizesOI build-up heatmapPCR trendMax pain trendFutures basisStock screens
Quarterly growersProfit growth stocksLow P/E stocksMutual fund buyingNear 52-week low, growingDebt-free companiesHigh ROE & ROCEMagic Formula stocksLow price-to-bookSmart money
FII / DII dataShareholding changesBig-money footprintShort selling dataF&O positions by participantBulk & block dealsPromoter buyingDelivery percentageCalendars
Results calendarQuarterly results trackerBoard meetingsCorporate actionsIPO calendarIPO performanceResearch & planning
Strategy testerCompare stocksDividend yield stocksASM / GSM listExpiry-day movesSeasonality & stock historyNSE holidays 2026Position size calculatorOption payoff calculatorPivot point calculatorMore
Stock scanners hubStock screensHow to use the Sector rotation chart
A complete, plain-language guide to sector rotation for Indian traders and investors: the four quadrants, how ChartMine builds its sector indices, what our test of 1,800 sector-weeks says, a weekly routine, three playbooks and four real case studies from 2026.
What sector rotation is, in plain words
The stock market is not one thing. It is twenty-odd groups of businesses (banks, IT, pharma, metals, autos and so on), and they rarely move together. In one season money pours into banks and autos; a few months later it moves to pharma and FMCG. This movement of money from one group to another is called sector rotation.
Why does it happen? Different businesses do well at different points of the economic cycle and react differently to interest rates, the rupee, commodity prices, monsoons and government policy. Big investors shift money to the groups they expect to benefit. Their buying makes some sectors beat the market for weeks or months while others lag.
The Sector rotation page shows this on one picture. Every NSE sector is a dot. Its position tells you two things: is the sector stronger or weaker than the average NSE stock, and is that strength rising or fading? A short trail shows where the dot came from over the last six weeks.
One line to remember: the rotation chart shows where money has been moving over the past weeks. It is a map of the present, not a forecast of which sector will win next.
The four quadrants, and how sectors move through them
The chart is split into four boxes by two lines that cross at 100. Right of the vertical line = stronger than usual against the average stock. Above the horizontal line = that strength is rising.
| Quadrant | Position | Plain meaning |
|---|---|---|
| 🟢 Leading | Top right | Beating the average stock, and the lead is growing. Money is flowing in. |
| 🟡 Weakening | Bottom right | Still ahead of the average stock, but the lead is shrinking. Momentum is fading. |
| 🔴 Lagging | Bottom left | Behind the average stock, and falling further behind. Money is flowing out. |
| 🔵 Improving | Top left | Still behind, but catching up. The first sign of interest. |
In theory sectors travel clockwise: improving → leading → weakening → lagging → improving. In practice, as our test below shows, they often jump straight across (leading to lagging, or lagging to leading) within a few weeks.
How the numbers are made
- The sectors come from NSE’s industry classification of the NIFTY Total Market stocks. Each sector index is the equal-weighted average daily move of its actively traded members (each day’s move capped at ±20% so a single freak print cannot dominate). Equal weight means one giant company cannot hide what the rest of the sector is doing.
- The yardstick is the average NSE stock, built the same equal-weighted way. So the chart compares like with like.
- Horizontal position (strength): the sector’s ratio to the average stock, divided by its own 10-week average of that ratio, × 100. Above 100 = stronger than its recent norm.
- Vertical position (momentum): that strength number divided by its own 5-week average, × 100. Above 100 = strength rising.
- Weekly: the chart uses each week’s last close. The trail shows six weekly points.
Because each sector is compared with its own recent trend, many sectors can be “leading” at the same time. On 6 Nov 2026, after a broad rally week, 13 of 20 sectors were in the leading box.
Why use it: advantages and limits
✅ The big picture in one glance
Twenty sectors, their strength and their direction, on one chart, updated every evening.
✅ Fish where the fish are
Stocks in strong sectors have the wind behind them. Many traders look for ideas in leading and improving sectors first.
✅ Early warning
A sector sliding from leading to weakening is a reason to tighten stops on stocks you hold in it.
✅ Fair comparison
Equal-weighted sectors against the equal-weighted average stock: no single heavyweight distorts the picture.
The limits (please read this part)
We rebuilt the chart for every week from January 2025 to October 2026 (about 1,800 sector-weeks) and checked how each sector did against the average stock over the next four weeks.
| Quadrant this week | Sector-weeks | Next 4 weeks vs average stock | Beat it | Still in the same quadrant 4 weeks later |
|---|---|---|---|---|
| Leading | 565 | +0.22% | 52% | 34% |
| Weakening | 293 | +0.14% | 52% | 25% |
| Lagging | 615 | −0.26% | 48% | 34% |
| Improving | 327 | −0.67% | 43% | 26% |
What this means in plain words:
- Leading sectors kept a small edge, but only a small one: they beat the average stock 52% of the time over the next month, by 0.22% on average.
- “Improving” was not a reliable early buy zone. Improving sectors did worse than any other group over the next four weeks (−0.67%, beat the average only 43% of the time).
- Quadrants change fast. Only about a third of leading sectors were still leading four weeks later, and 28% had jumped straight to lagging. From lagging, 26% jumped straight to leading.
- The test covers less than two years and the sectors overlap with each other, so treat these numbers as a rough guide.
So how should you use it? As a context and filter tool: know which sectors are in favour, prefer stock ideas that have the sector with them, and notice when your holdings’ sector is fading. Do not buy a sector just because its dot moved into a new box.
A tour of the Sector rotation page
Open Sector rotation. The page has three parts: the quadrant counts, the rotation chart, and the sector performance table.

- 1Leading
- 2Improving
- 3Weakening
- 4Lagging
The four boxes count the sectors in each quadrant and name them. On the week to 6 Nov 2026: 13 leading, 2 improving (Metal, Construction), 2 weakening (Services, IT), 3 lagging (Chemicals, Capital goods, Utilities).
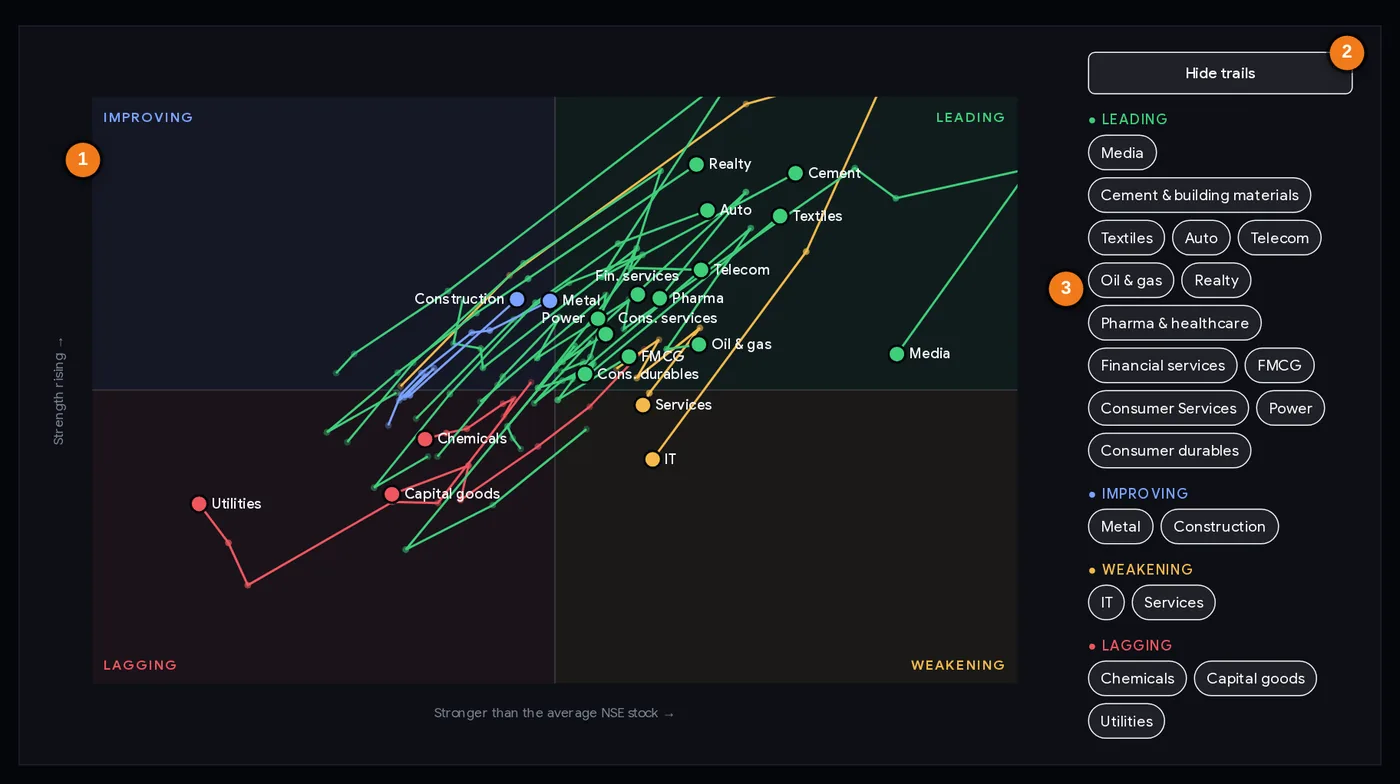
- 1Each dot is a sector; the four shaded boxes are the quadrants
- 2The trails button (here switched on, so it reads “Hide trails”)
- 3Sectors listed by quadrant, strongest first
Using the chart
- Each dot is a sector, coloured by its quadrant. The label is its short name.
- Hover a dot (or tap it on a phone) to see its six-week trail. Click a dot to open that sector’s page with every stock in it.
- The side panel lists sectors by quadrant. Tap a name to highlight its trail, or press Show all trails to see every sector’s path at once.
- Distance from the centre matters: a dot far to the right is much stronger than usual; a dot near the centre is close to average.
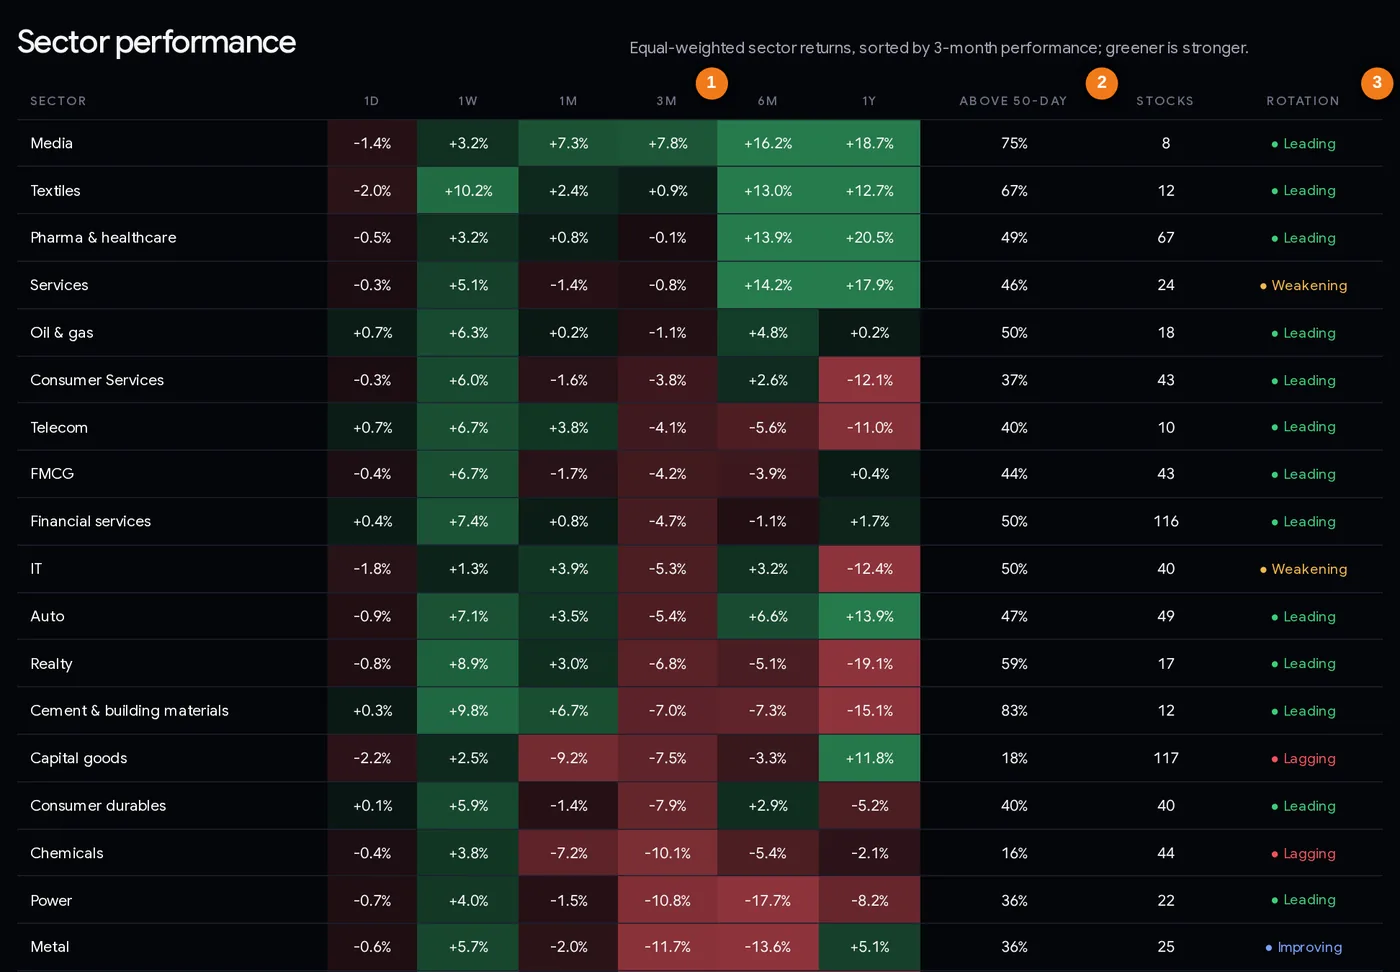
- 13-month return (the sort order)
- 2Share of the sector’s stocks above their 50-day average
- 3This week’s quadrant
The sector performance table
| Column | What it tells you |
|---|---|
| Sector | Click for the sector page: all its stocks with RS rating, returns and delivery. |
| 1D, 1W, 1M, 3M, 6M, 1Y | Equal-weighted sector return over each period. Greener = stronger, redder = weaker. Sorted by 3 months. |
| Above 50-day | Share of the sector’s stocks above their 50-day average: breadth inside the sector. |
| Stocks | How many actively traded stocks make up the sector. Small sectors (Utilities has 4) swing more. |
| Rotation | The sector’s quadrant this week. |
The table and the chart answer different questions. On 6 Nov 2026 Realty was leading on the chart but down 6.8% over 3 months and 19.1% over a year. The chart shows a recent turn; the table shows the longer record.
Step by step: a weekly sector review (15 minutes)
- Open the page at the weekend. The chart uses weekly closes, so Friday evening or the weekend is the natural time. The week shown is in the introduction (“Week to 6 Nov 2026”).
- Read the four boxes. Note any sector that changed quadrant since last week.
- Press “Show all trails”. Look for long trails moving in one direction (a strong, steady shift) versus short, tangled ones (no clear trend).
- Check the table for the same sectors. Is the 3-month and 6-month record positive too? A sector leading on the chart and strong over 3–6 months has a more established trend.
- Check breadth inside the sector (“Above 50-day”). 83% for Cement on 6 Nov means most of its stocks are in uptrends; 18% for Capital goods means very few are.
- Open one or two sector pages and sort by RS to find the strongest stocks inside the strongest sectors. The relative strength tutorial explains RS.
- Review what you hold. If a stock you own sits in a sector that moved to weakening or lagging, check your stop loss.
- Write it down: “In favour: …; fading: …; watch: …”. Compare next week.
Three ways traders and investors use it
Playbook A: top-down stock picking
Start with sectors, then pick stocks. Choose two or three sectors that are leading on the chart and positive over 3 months in the table. Open each sector page, sort by RS rating, and shortlist stocks with RS 80+ that are within 10–15% of their 52-week high. Then study each chart for a sensible entry and a stop loss. The sector filter does not replace the stock analysis; it narrows where you look.
Playbook B: holding review for investors
Once a week, find the sector of every stock you own. If a sector moves from leading to weakening, you do not have to sell, but you might stop adding to it and make sure you know your exit level. If it reaches lagging and the stock itself breaks its trend, that is two warnings instead of one.
Playbook C: avoid catching falling sectors
A sector that has fallen a lot looks cheap. The chart helps you wait: as long as the dot stays in lagging and moves further left, money is still leaving. Some traders only start looking once it has spent two or three weeks in improving and its breadth (“Above 50-day”) has risen above 50%. Our test shows improving alone is not enough, so this is about patience, not a signal.
Size every trade by its risk. Sector strength can reverse in a week. Use a stop loss and the position size calculator.
Case studies from 2026
Four sectors, rebuilt week by week with the page’s own method. “Relative” means the sector index divided by the average-stock index, so a +5% relative move means the sector beat the average stock by about 5%.
1. IT: lagging → improving → leading → weakening (Sep–Nov 2026)
IT sat in lagging for four weeks in September. On 1 Oct it moved to improving, on 16 Oct to leading, and it stayed there to 30 Oct. From 1 Oct to 23 Oct its relative line rose about 11.7%: IT clearly beat the average stock. Then the lead shrank, and on 6 Nov it slid to weakening, about 4.7% below its 23 Oct relative peak. This is the textbook clockwise loop, and it took only six weeks.
2. Capital goods: from leader to laggard (Aug–Nov 2026)
Capital goods was leading from 14 Aug to 11 Sep, weakening in late September, briefly leading again on 1 Oct, then lagging from 16 Oct. From its 1 Oct relative peak to 6 Nov it lost about 6% against the average stock. By 6 Nov the table showed −9.2% over a month and only 18% of its 117 stocks above their 50-day average. On 6 Nov it was the weakest sector of the day (−2.2%), and Thermax, one of its members, fell 17.3%. Lesson: the move from leading to weakening in September was the early warning.
3. Metal: the false start (Jul–Sep 2026)
Metal spent six weeks in improving (17 Jul to 21 Aug) and finally reached leading on 28 Aug. One week later it dropped straight to lagging, and its relative line fell about 6% from 28 Aug to 9 Oct. A trader who bought metals because the dot “finally” reached leading would have been caught. Lesson: one week in a new quadrant is not a trend; this is exactly the jump our test found in 28% of cases.
4. Realty: leading on the chart, weak on the table (Nov 2026)
Realty was lagging for most of August to mid-October, improving from 16 Oct, and leading on 6 Nov, with its relative line up about 6.9% since 9 Oct. Yet the same day’s table showed Realty −6.8% over 3 months and −19.1% over a year. Lesson: a dot in the leading box can be a short bounce inside a long decline. Always read the chart and the table together.
Common mistakes
- Treating a quadrant change as a buy or sell signal. Case 3: Metal reached leading for one week, then fell to lagging.
- Buying “improving” sectors early. In our test they did worst over the next four weeks.
- Ignoring the table. Case 4: leading on the chart, −19% over a year.
- Expecting a neat clockwise path. Sectors jumped across the chart often.
- Reading tiny sectors like big ones. Utilities has 4 stocks; one stock’s move shifts the whole dot.
- Comparing with NIFTY. The yardstick is the average NSE stock, not NIFTY 50. A sector can lead here and still lag NIFTY when large caps run.
- Checking it daily. It is a weekly chart; daily changes in the dots are mostly noise. For daily moves use the sector heatmap.
Weekly checklist
- The week shown is the latest completed week.
- Sectors that changed quadrant this week noted.
- Trails checked: long and steady, or short and tangled?
- Chart and table agree (leading and positive over 3–6 months)?
- Breadth inside the sector (“Above 50-day”) checked.
- Strongest stocks inside the strongest sectors shortlisted by RS.
- Holdings in weakening or lagging sectors: stop losses reviewed.
- No trade taken on the quadrant alone; every trade has an entry, stop and size.
Glossary
| Sector rotation | Money moving from one group of stocks to another over time. |
| Rotation chart | A chart of each sector’s relative strength (across) and its momentum (up). Also called a relative rotation graph. |
| Relative strength | A sector’s (or stock’s) performance compared with a benchmark, here the average NSE stock. |
| Momentum | Whether that relative strength is rising or falling. |
| Equal-weighted | Every stock counts the same, whatever its size. |
| Leading / weakening / lagging / improving | The four quadrants of the chart. |
| Trail | The path of a sector’s dot over the last six weeks. |
| Breadth (in a sector) | The share of the sector’s stocks above their 50-day average. |
Questions
What is sector rotation in the stock market?
Money moving from one group of stocks to another as the economy, interest rates and market mood change. ChartMine’s sector rotation chart shows each NSE sector’s strength against the average NSE stock and whether that strength is rising or fading.
How do you read a sector rotation chart?
Right of centre, the sector is beating the average NSE stock; above centre, that lead is growing. The four boxes are leading (top right), weakening (bottom right), lagging (bottom left) and improving (top left). The trail shows the last six weeks.
Which sectors are leading now?
The Sector rotation page lists them every week. For the week to 6 Nov 2026, 13 of 20 sectors were leading; IT and Services were weakening; Chemicals, Capital goods and Utilities were lagging.
Do leading sectors keep outperforming?
Only slightly, in our test. From January 2025 to October 2026, sectors in the leading quadrant beat the average NSE stock over the next four weeks 52% of the time, by 0.22% on average, and only about a third were still leading four weeks later.
How are ChartMine’s sector indices calculated?
From NSE’s industry classification of the NIFTY Total Market stocks. Each sector is the equal-weighted average daily move of its actively traded members, so a few large companies do not dominate it.
How often is the sector rotation chart updated?
The page is rebuilt every trading day evening, but the chart uses weekly closing points, so it is best read once a week.
What is the difference between sector rotation and the sector heatmap?
The rotation chart shows weekly strength and momentum against the average stock over the last six weeks. The sector heatmap shows each day’s move for every sector, live during market hours.