
☰ All tutorials
Start here
Tool tutorialsHow to trade with ChartMineStocks
Stock monitorMy watchlistStock scores & checklistMarket & sectors
Nifty 50Bank NiftySensexFin NiftyDaily market reportMarket breadthSector rotationSector heatmapStock screenerRelative strength (RS)MCX commodity pricesFear & Greed IndexWhat happens after…Scanners
Top gainers & losersStocks to watch tomorrowNR7 stocks scannerInside bar stocks52-week high stocksGap up & gap down stocksRSI oversold stocksGolden cross stocksSuperTrend buy stocksScan builderEMA 9/21 crossoverMACD crossoverADX strong trendBollinger breakout / squeezeVolume spike stocksOpen = high / open = lowCandlestick pattern scannerNarrow CPR scannerF&O data
F&O ban listOI build-upOption chainPCR & max painExpiry calendarF&O lot sizesOI build-up heatmapPCR trendMax pain trendFutures basisStock screens
Quarterly growersProfit growth stocksLow P/E stocksMutual fund buyingNear 52-week low, growingDebt-free companiesHigh ROE & ROCEMagic Formula stocksLow price-to-bookSmart money
FII / DII dataShareholding changesBig-money footprintShort selling dataF&O positions by participantBulk & block dealsPromoter buyingDelivery percentageCalendars
Results calendarQuarterly results trackerBoard meetingsCorporate actionsIPO calendarIPO performanceResearch & planning
Strategy testerCompare stocksDividend yield stocksASM / GSM listExpiry-day movesSeasonality & stock historyNSE holidays 2026Position size calculatorOption payoff calculatorPivot point calculatorMore
Stock scanners hubStock screensHow to use the SuperTrend buy stocks scanner
A plain-language tutorial on SuperTrend (10, 3): how the line is calculated, buy and sell flips, an honest one-year test, a tour of every part of the scanner, and three playbooks with real case studies.
What SuperTrend is, in plain words
SuperTrend is a trend-following line drawn on a price chart. When the stock is in an uptrend, the line sits below the price and is usually coloured green. When it is in a downtrend, the line sits above the price, usually red.
The rule is simple: as long as the price closes on the right side of the line, the trend is unchanged. When the price closes through the line, the trend flips:
- A close above the red line after a downtrend: a buy flip (the line turns green and jumps below the price).
- A close below the green line after an uptrend: a sell flip.
While the trend lasts, the line follows the price like a trailing stop: in an uptrend it can move up but never down. That is why many Indian traders use SuperTrend both to decide the direction and to place their stop loss.
One line to remember: SuperTrend tells you which side the trend is on and where a trailing stop could sit. It flips late by design, and in sideways markets it flips often.
The SuperTrend buy stocks scanner lists every F&O stock and main index whose daily SuperTrend flipped up (or down) in the last three sessions and still holds, every evening, with the line’s level, trend and volume.
How the SuperTrend line is calculated
The scanner uses the most common setting, SuperTrend (10, 3): a 10-day ATR and a multiplier of 3, on daily candles adjusted for splits and bonuses.
- True range (TR) for each day: the largest of (high − low), (high − previous close) and (previous close − low). It measures how much the stock really moved, including gaps.
- ATR (Average True Range): a smoothed 10-day average of TR. Each new day counts for 1/10.
- Middle of the day: (high + low) ÷ 2.
- Lower band = middle − 3 × ATR. Upper band = middle + 3 × ATR.
- The bands only tighten: in an uptrend the lower band can rise but not fall (unless the trend flips), and vice versa.
- Uptrend line = lower band. Downtrend line = upper band. A close beyond the active line flips the trend.
Example: Hindustan Aeronautics (HAL), 8 Apr 2026
On 8 Apr 2026 HAL closed at ₹3,907.50, above its red SuperTrend line, so the trend flipped up. The new green line was placed at ₹3,515.45, about 10% below the close. That distance is typical: in our data the median gap between the close and the line on a buy flip was 10.8%. If you use the line as your stop, you are accepting a large potential loss per share, so the position must be smaller.
Types of SuperTrend signals
| Signal | Rule | What traders read into it |
|---|---|---|
| Fresh buy flip | Close crosses above the line today | A new uptrend. The scanner’s “Turned up today” tab. |
| Recent buy flip | Flipped up in the last 3 sessions and still up | The “SuperTrend buy” tab: a little more time to study. |
| Sell flip | Close crosses below the line | A new downtrend; holders often use it as an exit. |
| Trend continuation | Price pulls back toward the line and bounces | A second chance to join the trend. Read it on the chart. |
| Whipsaw | Buy and sell flips within days | A sideways stock; the indicator is struggling. |
Settings people use
Smaller multipliers (like 2) put the line closer to price: earlier flips, tighter stops, more whipsaws. Larger ones (like 4) are slower and calmer. Intraday traders run SuperTrend on 5- or 15-minute charts. The scanner is fixed at daily (10, 3); if your chart uses (7, 3) or (10, 2), your flips will happen on different days.
Market-wide flips
On 10 Apr 2026, 78 F&O stocks were on the buy tab at once; on 5 Nov 2026, 74. When the whole market turns, most stocks flip together. That tells you about the market more than about any single stock.
Why traders use SuperTrend: advantages and limits
✅ Easy to read
Green or red, above or below. No interpretation needed.
✅ Built-in trailing stop
The line follows the price up and gives an objective exit.
✅ Adapts to volatility
Because it uses ATR, the line sits further away on wild stocks and closer on calm ones.
✅ Keeps you in big trends
When a stock trends for months, SuperTrend stays on the same side and avoids early exits.
The limits: what our own data says
We rebuilt the scanner’s history for 27 Oct 2025 to 6 Nov 2026 (217 F&O stocks, same adjusted data and code) and found 818 fresh buy flips and 799 fresh sell flips. Each was compared with the average F&O stock over the same days. Over the year NIFTY fell about 3.6% (25,966 to 25,030) and spent long stretches moving sideways.
| After the flip | Buy flip | Buy flip, above 200-DMA | Sell flip |
|---|---|---|---|
| Cases | 818 | 421 | 799 |
| Next day up | 49.5% | 48.8% | 55.2% |
| 5 sessions: versus the average stock | −0.29% | −0.29% | −0.04% |
| 20 sessions: versus the average stock | −0.38% | +0.41% | −0.33% |
| 60 sessions: versus the average stock | −0.50% | +0.01% | −0.60% |
| Flipped back within 10 sessions | 14.0% | – | – |
- A buy flip on its own had no edge in this period. Stocks that flipped up did slightly worse than the average stock over the next weeks.
- The 200-DMA filter helped a little over 20 sessions (+0.41% versus −0.38%), but not enough to call it an edge.
- Sell flips were followed by slightly weaker-than-average returns, which fits the signal, but the difference was small.
- One buy flip in seven reversed within two weeks (a whipsaw), and the typical stop at the line was about 10.8% away.
What this means: SuperTrend’s value is mostly in managing a trade (direction plus a trailing stop that keeps you in long trends), not in predicting which flips will work. In a sideways year like this one, flips were close to random. The trades that made money were the few long trends, so small losses on the many failed flips must be kept small.
A tour of the scanner screen
Open the SuperTrend buy stocks scanner. There are three tabs, the filters and the results table, sorted by volume (highest first).

- 1Scan for: pick a scan date; the latest is first.
- 2SuperTrend buy: flipped up in the last 3 sessions and still up.
- 3Turned up today: fresh buy flips.
- 4SuperTrend sell: flipped down in the last 3 sessions.
On 6 Nov 2026, after a rising week, 65 F&O stocks were on the buy tab, 6 had turned up that day (Havells, HDFC Life, Nestlé India, SBI Life, Sun Pharma and Yes Bank) and only one was on the sell tab.
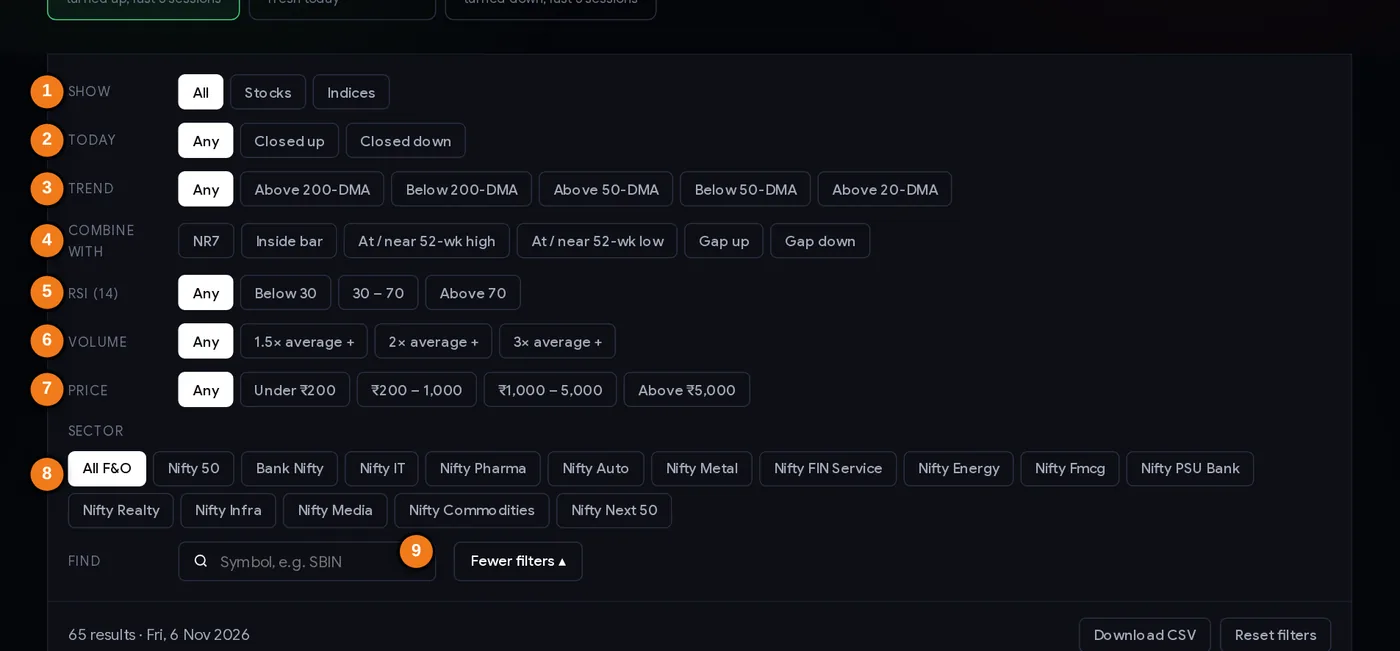
- 1Show: stocks or indices
- 2Today: closed up or down
- 3Trend: versus the 20-, 50- or 200-day average
- 4Combine with another setup
- 5RSI (14)
- 6Volume versus the 20-day average
- 7Price band
- 8Sector (index membership)
- 9Find a symbol
The filters
- Show: stocks, indices or both.
- Today: closed up or down on the scan day.
- Trend: close versus the 20-, 50- or 200-day average. Many traders take buy flips only above the 200-DMA.
- Combine with: NR7, inside bar, 52-week high or low, gaps.
- More filters: RSI, volume (1.5×, 2×, 3×), price band, sector.
- Find a symbol; filters stay in the page address.
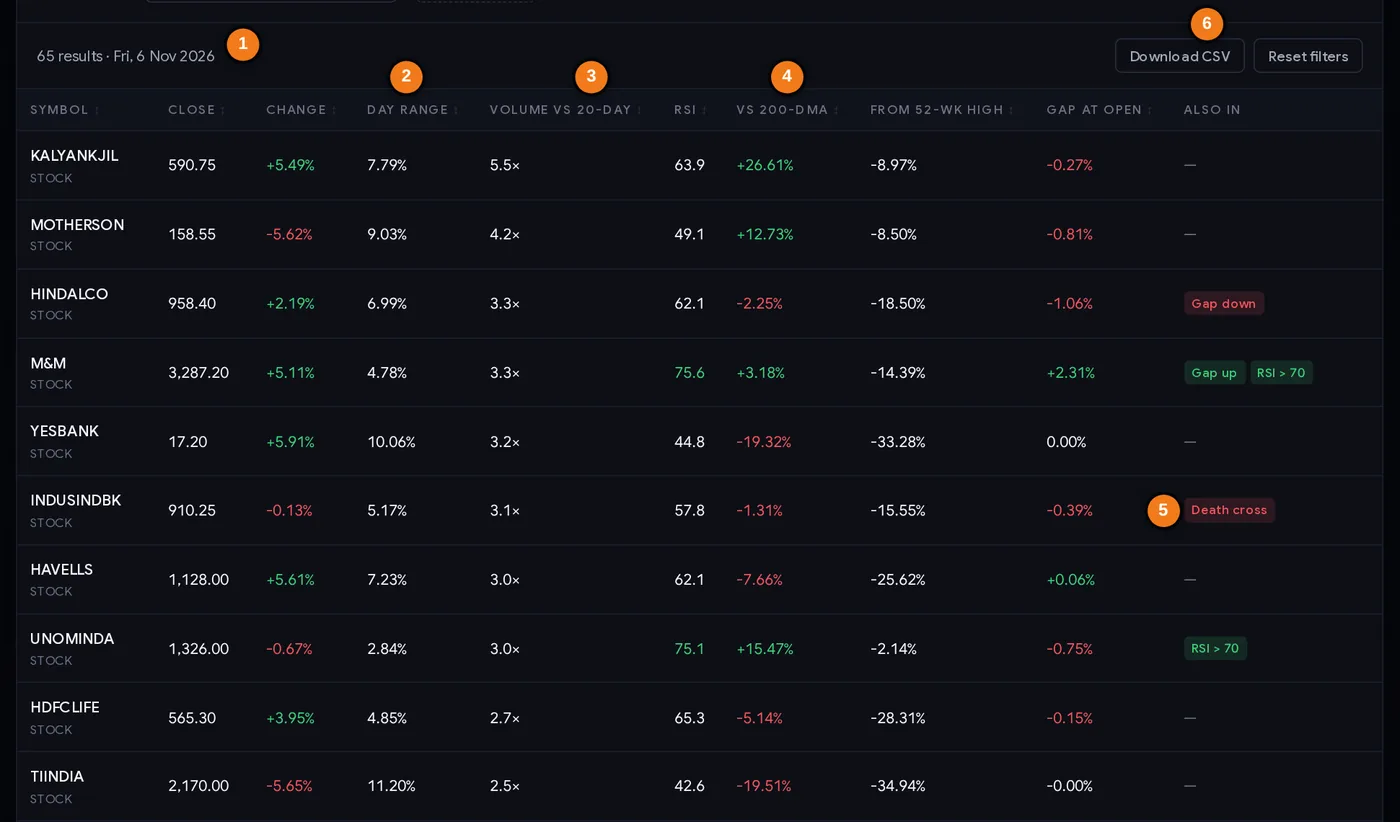
- 1Result count and scan date
- 2Day range %
- 3Volume versus the 20-day average
- 4Distance from the 200-day average
- 5Other scans the stock matched today
- 6Download the list as CSV
Every column explained
| Column | What it tells you |
|---|---|
| Close / Change | The close and % change on the scan day. |
| Day range | (High − Low) ÷ Close. |
| Volume vs 20-day | The default sort. A flip on 2–3× volume has more participation behind it. |
| RSI | Momentum. A buy flip with RSI already near 70 has run a lot. |
| vs 200-DMA | Long-term trend. Negative = the flip is against the long-term trend. |
| From 52-wk high | Where the stock sits in its year. |
| Gap at open | The opening gap on the scan day. |
| Also in | Other scans matched today. Conflicts are informative: IndusInd Bank showed a SuperTrend buy and a death cross on the same day. |
The table does not show the SuperTrend line’s price, and the Download CSV file does not include it either (it holds the table columns plus the 20-, 50- and 200-day averages and the 52-week levels). To see the line itself, add SuperTrend (10, 3) to your daily chart.
Note on older dates. The SuperTrend tabs were added to the scanner on 8 Nov 2026, so earlier dates in the date box show no flips. The history in this tutorial was rebuilt separately with the same code.
Step by step: an evening routine
- Open the scanner in the evening (after about 8 PM IST) and check the date.
- Read the counts. 60+ buy flips means the market turned; focus on the strongest few rather than all of them.
- Start with “Turned up today”, then add the trend filter “Above 200-DMA”.
- Prefer flips on 1.5× volume or more and check that RSI is not already stretched.
- Open the chart with SuperTrend (10, 3) and note the line’s level. Is the stock coming out of a long sideways range (whipsaw risk) or a clean decline?
- Remove event risk: results, board meetings.
- Size the trade from the distance to the line (or a closer stop you choose) with the position size calculator.
Three playbooks
Playbook A: trend-aligned flip with a trailing stop
- Fresh buy flip, close above the 200-DMA, volume 1.5×+.
- Entry next day, ideally above the flip day’s high.
- Initial stop: the SuperTrend line, or a closer level (for example the flip day’s low) if the line is too far for your risk budget.
- Exit: when the stock closes below the line (a sell flip). Let the line trail; do not move it down.
Playbook B: buy the first pullback
Rather than buying the flip day, wait for the first pullback toward the green line that holds (a close back up). The stop can then sit just below the line, much closer than on the flip day. You miss stocks that never pull back, but your risk per share is smaller.
Playbook C: SuperTrend as an exit tool only
Many investors pick stocks by other means (fundamentals, 52-week highs, sector strength) and use SuperTrend only to decide when to step aside: a weekly or daily sell flip is their signal to exit or reduce. This uses the indicator for what it does best.
A wide line means a small position. With the line 10% away and ₹1,000 of risk per trade, you can hold only ₹10,000 worth of stock. Respect that arithmetic.
Case studies from 2026
Four real flips. Prices in ₹ from NSE’s daily files, adjusted for corporate actions.
1. HAL, 8 Apr 2026: the trend that paid for everything
Buy flip at 3,907.50 (line 3,515.45). Twenty sessions later HAL was 22.5% higher. The trend held until a sell flip on 15 May at 4,386.20: a gain of about 12% from flip to flip, after giving back part of the peak. This is the kind of trade SuperTrend is built for.
2. ONGC, 14 May 2026: the quick whipsaw
Buy flip at 300.90 (line 277.82). Within ten sessions it traded as low as 261.55, and on 27 May it flipped to sell at 274.05: a loss of about 9% from flip to flip. One failed flip like this cancels most of a good trade, which is why position size matters.
3. ICICI Bank, 11 Jun 2026: the slow, steady hold
Buy flip at 1,317. The stock moved up gradually and the trend held for three months until a sell flip on 10 Sep at 1,384.50: about 5% from flip to flip, with no stop-out along the way. Not dramatic, but SuperTrend kept the trader in without second-guessing.
4. DLF, 8–15 Jun 2026: the sell flip that reversed
Sell flip on 8 Jun at 561.30. One week later, on 15 Jun, it flipped back to buy at 614.45, about 9.5% higher. Anyone who sold or shorted on the sell flip lost on both sides. Whipsaws happen in both directions.
Common mistakes
- Treating every buy flip as a buy. In our test, buy flips on their own did slightly worse than the average stock.
- Using the line as a stop without resizing. The line was about 10.8% away on a typical flip.
- Ignoring sideways markets. One flip in seven reversed within ten sessions (ONGC, DLF).
- Mixing settings. (7, 3) and (10, 3) flip on different days; know what you are looking at.
- Moving the stop down when the price nears the line. The line only moves in the trend’s direction; so should your stop.
- Trading all 60 flips on a market-wide day. Pick the few with trend, volume and a clean chart.
- Forgetting events. Results can jump the price through the line overnight.
Pre-trade checklist
- Scan date is the latest trading day; market-wide flip count noted.
- Fresh flip (today or within 3 sessions) and still holding.
- Close above the 200-DMA for buy flips (below for sell flips).
- Volume 1.5× or more; RSI not already stretched.
- Chart checked: not a choppy sideways range.
- Stop chosen (line or closer); position size from that stop.
- No results or major event before your planned exit.
- Exit rule: a close beyond the line; no moving the stop against the trend.
Glossary
| SuperTrend | A trend line placed a multiple of ATR below (uptrend) or above (downtrend) the price. |
| Flip | The trend changing side after a close through the line. |
| True range (TR) | The day’s full movement including any gap from the previous close. |
| ATR | Average True Range, a smoothed average of TR (10 days here). |
| Multiplier | How many ATRs away the line sits (3 here). |
| Trailing stop | A stop that moves with the trend but never against it. |
| Whipsaw | Signals flipping back and forth in a sideways market. |
| 200-DMA | The 200-day average closing price, a long-term trend line. |
Questions
What is a SuperTrend buy signal?
A buy signal (buy flip) is when a stock closes above its SuperTrend line after a downtrend, turning the line green below the price. ChartMine’s scanner lists F&O stocks and indices whose daily SuperTrend (10, 3) flipped up in the last three sessions.
What is the best SuperTrend setting for daily charts?
(10, 3), a 10-day ATR with a multiplier of 3, is the most common and is what the scanner uses. Lower multipliers flip earlier with more false signals; higher ones are slower.
Is SuperTrend accurate?
As a predictor, not on its own. In ChartMine’s test of 818 buy flips (Oct 2025 to Nov 2026), the stocks did slightly worse than the average F&O stock over the following weeks and 14% flipped back within ten sessions. Its strength is as a trailing stop that keeps you in long trends.
Can SuperTrend be used as a stop loss?
Yes, many traders use the line as a trailing stop. On daily charts it is often far from the price (a median of about 10.8% at a buy flip in our data), so the position size must be reduced to keep the rupee risk small.
Why does SuperTrend give false signals?
In sideways markets the price keeps crossing the line, causing flips in both directions (whipsaws). Filtering with the 200-day average, volume and a clean chart reduces, but does not remove, these.
Does SuperTrend work for intraday trading?
Traders use it on 5- or 15-minute charts, but the scanner works on daily candles. Intraday signals are faster and noisier; the same risk rules apply.