
☰ All tutorials
Start here
Tool tutorialsHow to trade with ChartMineStocks
Stock monitorMy watchlistStock scores & checklistMarket & sectors
Nifty 50Bank NiftySensexFin NiftyDaily market reportMarket breadthSector rotationSector heatmapStock screenerRelative strength (RS)MCX commodity pricesFear & Greed IndexWhat happens after…Scanners
Top gainers & losersStocks to watch tomorrowNR7 stocks scannerInside bar stocks52-week high stocksGap up & gap down stocksRSI oversold stocksGolden cross stocksSuperTrend buy stocksScan builderEMA 9/21 crossoverMACD crossoverADX strong trendBollinger breakout / squeezeVolume spike stocksOpen = high / open = lowCandlestick pattern scannerNarrow CPR scannerF&O data
F&O ban listOI build-upOption chainPCR & max painExpiry calendarF&O lot sizesOI build-up heatmapPCR trendMax pain trendFutures basisStock screens
Quarterly growersProfit growth stocksLow P/E stocksMutual fund buyingNear 52-week low, growingDebt-free companiesHigh ROE & ROCEMagic Formula stocksLow price-to-bookSmart money
FII / DII dataShareholding changesBig-money footprintShort selling dataF&O positions by participantBulk & block dealsPromoter buyingDelivery percentageCalendars
Results calendarQuarterly results trackerBoard meetingsCorporate actionsIPO calendarIPO performanceResearch & planning
Strategy testerCompare stocksDividend yield stocksASM / GSM listExpiry-day movesSeasonality & stock historyNSE holidays 2026Position size calculatorOption payoff calculatorPivot point calculatorMore
Stock scanners hubStock screensHow to use the MACD crossover stocks scanner
A plain-language tutorial on MACD: what the three lines mean, why crossovers above and below zero differ, a two-year test on 1,474 NSE stocks, a tour of the scanner and three playbooks with real case studies.
What MACD is, in plain words
MACD stands for Moving Average Convergence Divergence. The name is heavy, but the idea is light: it measures whether a stock’s short-term momentum is speeding up or slowing down compared with its slightly longer-term momentum.
It was created by Gerald Appel in the late 1970s and is now on almost every charting platform. You will usually see it in a small panel below the price chart, with three parts:
- the MACD line, which shows the gap between a fast and a slow average of the price;
- the signal line, a smoothed copy of the MACD line;
- the histogram, bars showing the distance between the two lines.
When the MACD line crosses above its signal line, momentum is improving: a bullish crossover. When it crosses below, momentum is fading: a bearish crossover. Where this happens, above or below the zero line, adds a second layer of meaning, explained below.
One line to remember: MACD is momentum built from moving averages. A crossover says the recent push has changed direction; it says nothing about how far the price will go.
The MACD crossover stocks scanner checks every actively traded NSE stock after each close and lists those whose MACD (12, 26, 9) crossed its signal line in the last three sessions.
How MACD (12, 26, 9) is calculated
The three numbers in “MACD (12, 26, 9)” are the settings. These are the standard values and the ones the scanner uses, on daily closes adjusted for splits and bonuses.
- Fast EMA: the 12-day exponential moving average of closes (recent days weigh more).
- Slow EMA: the 26-day exponential moving average.
- MACD line = 12-day EMA − 26-day EMA. Positive means the fast average is above the slow one (prices have been rising lately); negative means the opposite.
- Signal line = the 9-day EMA of the MACD line itself.
- Histogram = MACD line − signal line. A crossover is simply the histogram changing sign.
Real example: Kennametal India, 13 Nov 2026
| Value on 13 Nov 2026 | Kennametal India | What it means |
|---|---|---|
| Close | ₹3,954.80 (+13.94%) | A big up day on 41.7× normal volume |
| MACD line | −117.87 | The 12-day EMA is still about ₹118 below the 26-day EMA: the bigger trend is down |
| Signal line | −128.75 | The smoothed MACD is even lower |
| Histogram | +10.88 | MACD has just moved above its signal: a bullish crossover, that day |
So on one day the stock shows both a down medium-term picture (MACD below zero) and an improving short-term one (MACD above signal). The scanner puts it on the “Bullish, below zero” tab.
MACD is in rupees, not per cent
The MACD line is a price difference, so its size depends on the share price. On 13 Nov Page Industries (around ₹31,000) had a MACD of −607, while a ₹40 stock had values below 1. Never compare MACD values across stocks; compare only where the lines are relative to each other and to zero.
The scanner’s exact rule
- A bullish crossover: the histogram was at or below zero the session before and above zero on the day. The stock is listed if this happened today or in either of the two previous sessions, and the histogram is still positive today.
- A bearish crossover is the mirror image.
- Stocks need at least 60 sessions of history.
Types of MACD signals
| Signal | Rule | What traders read into it |
|---|---|---|
| Bullish crossover | MACD crosses above its signal line | Momentum turning up. The scanner’s first tab. |
| Bullish, below zero | The cross happens while MACD is negative | An early turn inside a downtrend: earlier, riskier. The second tab. |
| Bullish, above zero | The cross happens while MACD is positive | Momentum resuming inside an uptrend, often after a pause. |
| Bearish crossover | MACD crosses below its signal line | Momentum fading. The third tab. |
| Zero-line cross | MACD itself crosses zero | The 12-day EMA crossing the 26-day EMA: a slower trend change. Read it on the chart. |
| Divergence | Price makes a new high (or low) but MACD does not | Momentum not confirming the price. Only visible on a chart. |
| Histogram shrinking | Bars getting shorter for several days | The current push losing strength before any crossover. |
Divergence, explained simply
Suppose a stock makes a higher high this month than last month, but the MACD peak this month is lower than last month’s. The price went further, yet the push behind it was weaker. Traders call this a bearish divergence and treat it as a warning, not a sell signal: divergences can last for weeks while the price keeps rising. The scanner does not detect divergences; you need to look at the chart.
Other settings
Some traders use faster settings such as (8, 17, 9) or (5, 35, 5) for shorter swings, or apply (12, 26, 9) to weekly charts for long-term views. Faster settings mean more crossovers and more false ones. If your chart uses different numbers, its crossovers will fall on different days from the scanner’s.
Why traders use MACD: advantages and limits
✅ Trend and momentum in one panel
Zero line for the bigger trend, signal line for the short-term push.
✅ Clear events
A crossover is a yes/no event, easy to scan across 1,300 stocks.
✅ Early warnings
A shrinking histogram or a divergence can flag a tiring move before the price turns.
✅ Standard everywhere
The 12, 26, 9 setting is the default on most platforms, so your chart will match.
The limits
- It is built from averages, so it lags. By the time the lines cross, the price has usually moved for several days.
- It crosses very often. The signal line is fast. In our test, MACD gave almost twice as many bullish crossovers as the 9/21 EMA rule, and about half of them reversed within ten sessions.
- Flat markets produce noise. When the price drifts sideways, MACD hovers near zero and crosses its signal line again and again.
- Values are not comparable across stocks, because MACD is measured in rupees.
- Gaps distort it. A results-day gap moves both EMAs at once and can create a crossover that says more about one day than about momentum.
An honest two-year test of MACD crossovers
We rebuilt the scanner’s rule on 1,474 NSE stocks from ChartMine’s current list, using adjusted daily prices, for signals from 15 Jan 2025 to 13 Nov 2026. For each crossover we measured what the stock did next and compared it with the average stock over the same days. Over this stretch NIFTY rose about 8%, but only 46.8% of stocks were higher 20 sessions later on a typical day, so that is the bar to clear.
| After the crossover | All bullish | Bullish, below zero | Bullish, above zero | Bullish, volume 1.5×+ | All bearish |
|---|---|---|---|---|---|
| Cases | 25,093 | 17,226 | 7,867 | 8,258 | 24,085 |
| Higher after 20 sessions | 46.5% | 45.8% | 48.1% | 44.7% | 46.6% |
| 20 sessions: versus the average stock | −0.01% | −0.07% | +0.11% | −0.20% | +0.01% |
| 60 sessions: versus the average stock | −0.07% | −0.39% | +0.59% | −0.37% | +0.19% |
What the numbers say
- No edge from the crossover alone. 25,093 bullish crossovers were followed by returns almost identical to the average stock.
- Bearish crossovers did not lead to underperformance either (+0.01% over 20 sessions).
- Above zero did a little better than below zero. Crossovers inside an uptrend beat the average by 0.59% over 60 sessions; early-turn crossovers below zero trailed by 0.39%. Small differences, but they point the same way as the EMA and ADX tests: moving with the existing trend was slightly better than trying to catch a turn.
- High volume did not help; crossovers on 1.5× volume did slightly worse.
- Half reversed quickly: 51.7% of bullish crossovers crossed back below the signal line within ten sessions.
- F&O stocks only (4,116 bullish crossovers): 50.7% higher after 20 sessions, 0.27% ahead of the average stock. Slightly better, still small.
- Below zero but above the 200-DMA (3,486 cases from Aug 2025): only 42.0% higher after 20 sessions, though the average return was 0.17% ahead, lifted by a few large winners.
What this means: a MACD crossover is a frequent, noisy event. Used alone, it was close to a coin toss in this period. Its value is in describing momentum while you make decisions with other tools: trend, support, events and, above all, a stop and a position size you can live with. The test uses today’s stock list, so delisted stocks are missing, which flatters the results slightly.
A tour of the scanner screen
Open the MACD crossover stocks scanner. The scan date sits at the top right and the three tabs below the heading.

- 1Scan for: pick a scan date; the latest is first.
- 2Bullish crossover: MACD crossed above its signal line in the last 3 sessions.
- 3Bullish, below zero: the same, while MACD is still negative.
- 4Bearish crossover: MACD crossed below its signal line in the last 3 sessions.
On the scan of 13 Nov 2026, 119 stocks were on the bullish tab (39 crossed that day, 36 the day before and 44 two days before), 91 of them with MACD still below zero, and 48 on the bearish tab. Across the whole list, 1,128 of about 1,300 stocks had MACD above the signal line, but only 652 had MACD above zero: momentum had picked up during the market’s rally from its late-October low (NIFTY went from 22,600 on 23 Oct to 25,144 on 13 Nov), while many medium-term trends were still down.
The “Bullish, below zero” tab

- 1Result count and scan date
- 2Volume versus the 20-day average (default sort)
- 3RSI (14)
- 4Distance from the 200-day average
- 5Other scans the stock matched that day
This tab keeps the early turns. The table is sorted by volume versus the 20-day average, highest first. The columns are the same on every tab:
| Column | How to use it with MACD |
|---|---|
| Close / Change | A crossover on a big up day has already moved; on a flat day it may be a slow drift. |
| Day range | (High − Low) ÷ Close. Very wide days often come with news. |
| Volume vs 20-day | The default sort. In our test, high volume did not improve results, so use it to spot news, not as a signal. |
| RSI | A second momentum gauge. RSI under 40 with a bullish crossover means the stock is turning from weak levels. |
| vs 200-DMA | The long-term trend. Below-zero crossovers above the 200-DMA are pullbacks in an uptrend; below it, turns in a downtrend. |
| From 52-wk high | How far the stock has fallen from its yearly high. |
| Gap at open | A crossover caused by a gap is less reliable. |
| Also in | Other scans matched that day: EMA 9/21 up, ADX uptrend, SuperTrend buy, Volume 3× and more. |
The MACD, signal and histogram values are not shown in the table or in the Download CSV file; add MACD (12, 26, 9) to your chart to see them.
Filters, and a filtered list
The filter panel is the same as on ChartMine’s other scanners: Show (stocks only here), Today (closed up or down), Trend (above or below the 200-, 50- or 20-day average), Combine with (NR7, inside bar, 52-week high or low, gaps) and, under More filters, RSI, volume, price band and sector (NSE index lists). Every choice is saved in the page address.
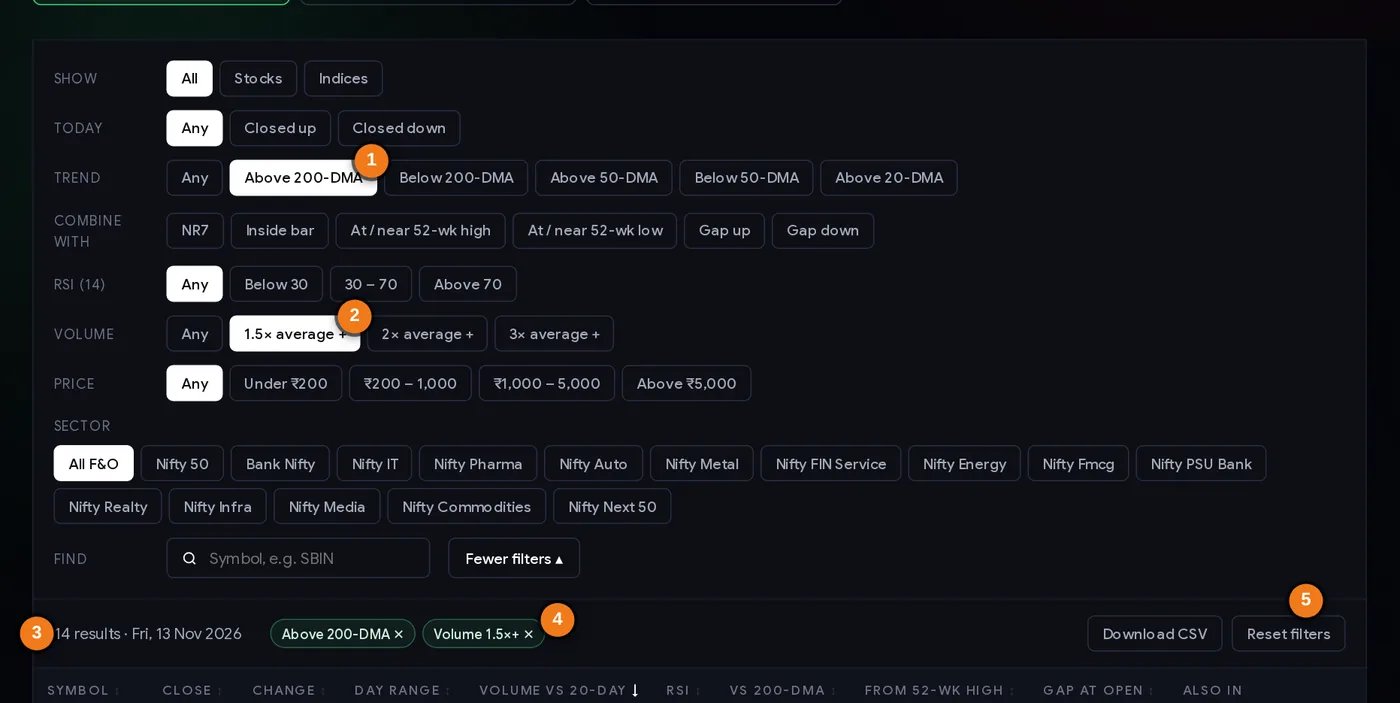
- 1Trend filter: above the 200-day average
- 2Volume filter: at least 1.5× the 20-day average
- 3Results left after filtering
- 4Active filters as chips (click ✕ to remove)
- 5Clear all filters
Here the bullish tab is filtered to stocks above the 200-DMA with at least 1.5× volume: 14 of the 119 remain. The active filters appear as chips next to the result count; click a chip’s ✕ to remove it, or “Reset filters” to clear them all.
Step by step: a weekly MACD review
MACD crossovers are frequent, so a weekly rhythm with a short daily check often works better than reacting to every cross.
- Daily, after about 8 PM IST: open the scanner, note the three tab counts and how many crossed “today”. A sudden jump in bullish crossovers across the market usually follows a market-wide bounce.
- Decide which kind of setup you are looking for. Trend continuation: bullish tab with Trend “Above 200-DMA”. Early turn: “Bullish, below zero”, accepting more failures.
- Remove stretched names: skip stocks that crossed on a 10%+ day or with RSI above 70.
- Open the chart with MACD (12, 26, 9). Is the histogram growing for a second and third day, or did it barely poke above zero? Is there a clear support level (a prior low) close below the price?
- Check events: results and board meetings in the coming days.
- Plan the trade on paper: entry trigger, stop below support, size with the position size calculator, and an exit rule.
- At the weekend: review the week’s crossovers you noted. How many crossed back? Keeping this simple diary teaches you more about MACD than any article.
Three playbooks
Playbook A: the early turn at support
- “Bullish, below zero” tab. On the chart, the price is near a clear support level, for example a prior swing low or the 200-DMA.
- Entry only after the stock closes above the crossover day’s high, showing follow-through.
- Stop just below the support level. Because the turn is early, the stop is often close, which keeps the loss small when it fails, as about half do.
- Exit if MACD crosses back below the signal line, or at the stop.
Playbook B: the continuation in an uptrend
- Bullish tab, Trend “Above 200-DMA”, MACD above zero (check the chart). The stock paused or pulled back and momentum is picking up again.
- Stop below the low of the pullback.
- Many traders hold while the histogram stays positive and take some profit when it shrinks for several days in a row.
Playbook C: MACD for managing what you hold
For stocks you already own, a bearish crossover above zero, or a bearish divergence on the chart, is a prompt to review: tighten the stop, book part of the profit or simply watch more closely. It is not a reason to act on its own. In our test bearish crossovers were not followed by underperformance on average, so automatic selling on every cross would have churned the portfolio without benefit.
Risk first: with about half of crossovers reversing within two weeks, assume most trades will be small losses or small gains. Decide your maximum loss per trade (for example 1% of capital) before you look at any list.
Case studies from 2026
Prices in ₹ from NSE’s daily files, adjusted for splits and bonuses.
1. HAL and Bajaj Finance, 6 Apr 2026: when the whole market turns
On 6 Apr 2026 Hindustan Aeronautics crossed bullish with MACD deep below zero (−118.49) at ₹3,752.10. Twenty sessions later, on 6 May, it closed at ₹4,626.90 (+23.3%). The same day Bajaj Finance crossed below zero at ₹850.85 and was at ₹980.75 (+15.3%) twenty sessions later. Many large stocks gave below-zero crossovers in that first week of April as the market bounced from its March lows. The lesson: some of the best below-zero crossovers come in clusters, when the whole market turns, and the market did most of the work.
2. ONGC, 14 May 2026: the textbook signal that failed
Bullish crossover above zero (MACD +3.29), price above the 200-DMA, at ₹300.90: on paper the “continuation” setup of Playbook B. MACD crossed back below the signal line within ten sessions, and on 12 Jun ONGC closed at ₹246.20, 18.2% lower. A stop under the pullback low would have closed the trade long before that.
3. Kennametal India, 13 Nov 2026: a crossover made by one day
The stock jumped 13.94% to ₹3,954.80 on 41.7× its usual volume, and the opening gap was never filled. That single day turned the histogram positive (+10.88) while MACD stayed well below zero (−117.87). The 200-DMA column was blank for this stock. A crossover produced by one news-like day tells you about that day; watching whether the next sessions hold the gain says more than the crossover itself.
4. Black Box, 11–13 Nov 2026: above zero with company
Black Box crossed bullish two sessions before the scan, with MACD above zero (8.82 against a signal of 2.10). On 13 Nov it closed at ₹900.70 (+1.91%) on 6.5× volume, 20.87% above its 200-DMA, and the 9/21 EMA had also crossed up. Several tools agreeing makes a cleaner chart, though our test found that agreement adds only a little on average.
5. Page Industries, 12–13 Nov 2026: a bearish crossover after the fall
MACD crossed below its signal on 12 Nov, and by 13 Nov it was far below it (−607.00 against −348.59). The stock closed at ₹31,325 (−1.65%) on 8.8× volume, 28.57% below its 52-week high, with RSI at 29.6 and the EMA, SuperTrend and Bollinger scans all bearish too. When every indicator agrees on the downside, most of the fall has usually happened already; a holder’s decision belongs to the day the trend broke, not the day all the lines confirm it.
Common mistakes
- Treating each crossover as a trade. In two years of data, crossovers alone matched the average stock.
- Comparing MACD values between stocks. They are in rupees; −600 on a ₹31,000 stock is not “weaker” than −1 on a ₹40 stock.
- Ignoring where the cross happens. Below zero is an early, riskier turn; above zero is a continuation. Know which one you are trading.
- Mixing settings. A chart on (8, 17, 9) will not match a (12, 26, 9) scan.
- Selling every bearish crossover. That churns the portfolio; our test found no average benefit.
- Reading divergence as a timing signal. Divergences can last for weeks.
- Forgetting that one gap can make a crossover, as with Kennametal on 13 Nov.
- No stop. With half the crossovers reversing quickly, a missing stop turns small failures into big ones (ONGC, May 2026).
Pre-trade checklist
- Latest scan date; tab counts noted (market-wide wave or a few stocks?).
- Type of setup chosen: continuation (above zero) or early turn (below zero).
- Crossover not caused by a single gap or a 10%+ day.
- Trend checked with the 200-DMA column; RSI not stretched.
- Chart checked: histogram growing, support level identified.
- Stop below support; position size from the stop.
- No results or board meeting before the planned exit.
- Exit rule written down (bearish crossover, stop, or both).
Glossary
| MACD line | 12-day EMA minus 26-day EMA of closing prices. |
| Signal line | 9-day EMA of the MACD line. |
| Histogram | MACD line minus signal line; its sign changes at every crossover. |
| Zero line | MACD = 0, where the 12-day and 26-day EMAs are equal. |
| Bullish crossover | MACD moving above its signal line. |
| Bearish crossover | MACD moving below its signal line. |
| Divergence | Price and MACD disagreeing: a new price high or low that MACD does not match. |
| Momentum | The speed and direction of recent price change. |
| EMA | Exponential moving average, which weights recent closes more. |
Questions
What is a MACD bullish crossover?
It is when the MACD line (12-day EMA minus 26-day EMA) crosses above its signal line (a 9-day EMA of MACD). It shows momentum turning up. ChartMine’s scanner lists NSE stocks with a MACD crossover in the last three sessions.
What does a MACD crossover below zero mean?
The momentum has turned up while the MACD line is still negative, meaning the 12-day average is below the 26-day average. It is an early turn inside a downtrend: earlier than a crossover above zero, but with more failures.
Is MACD a good indicator for swing trading?
It is widely used to describe momentum, but in our test of 25,093 bullish crossovers on NSE stocks (Jan 2025 to Nov 2026) the stocks matched the average stock and about half reversed within ten sessions. It works best as one input with trend, support and risk management.
What are the best MACD settings for daily charts?
12, 26 and 9 is the standard and what the scanner uses. Faster settings give earlier but noisier crossovers.
What is MACD divergence?
When the price makes a new high (or low) but MACD does not. It shows momentum not confirming the price and is read as a warning, not a timing signal.
What is the MACD histogram?
Bars showing MACD minus the signal line. Growing bars mean momentum is strengthening; shrinking bars mean it is fading. The bars change sign at each crossover.
Why can't I compare MACD values between stocks?
MACD is a difference between two prices, measured in rupees, so a high-priced stock naturally has bigger MACD numbers. Compare the lines’ positions, not their sizes.