
☰ All tutorials
Start here
Tool tutorialsHow to trade with ChartMineStocks
Stock monitorMy watchlistStock scores & checklistMarket & sectors
Nifty 50Bank NiftySensexFin NiftyDaily market reportMarket breadthSector rotationSector heatmapStock screenerRelative strength (RS)MCX commodity pricesFear & Greed IndexWhat happens after…Scanners
Top gainers & losersStocks to watch tomorrowNR7 stocks scannerInside bar stocks52-week high stocksGap up & gap down stocksRSI oversold stocksGolden cross stocksSuperTrend buy stocksScan builderEMA 9/21 crossoverMACD crossoverADX strong trendBollinger breakout / squeezeVolume spike stocksOpen = high / open = lowCandlestick pattern scannerNarrow CPR scannerF&O data
F&O ban listOI build-upOption chainPCR & max painExpiry calendarF&O lot sizesOI build-up heatmapPCR trendMax pain trendFutures basisStock screens
Quarterly growersProfit growth stocksLow P/E stocksMutual fund buyingNear 52-week low, growingDebt-free companiesHigh ROE & ROCEMagic Formula stocksLow price-to-bookSmart money
FII / DII dataShareholding changesBig-money footprintShort selling dataF&O positions by participantBulk & block dealsPromoter buyingDelivery percentageCalendars
Results calendarQuarterly results trackerBoard meetingsCorporate actionsIPO calendarIPO performanceResearch & planning
Strategy testerCompare stocksDividend yield stocksASM / GSM listExpiry-day movesSeasonality & stock historyNSE holidays 2026Position size calculatorOption payoff calculatorPivot point calculatorMore
Stock scanners hubStock screensHow to use the IPO calendar
A plain-language guide to IPOs: price band, lot size, subscription and allotment, how to read the calendar, the scorecard and each IPO’s own page, and what 227 recent main-board listings show about listing-day gains and what came after.
What an IPO is, in plain words
An IPO (initial public offering) is the first time a company sells its shares to the public. Before the IPO the company is owned by its founders, employees and private investors. After it, anyone with a demat account can own a piece of it and trade the shares on NSE and BSE.
The money raised can go to the company (a fresh issue, to fund growth or repay debt), to existing owners who are selling part of their stake (an offer for sale), or both.
The IPO calendar does three things. It lists the IPOs that are open or coming up on NSE, with dates, price band and size. It keeps a scorecard of every main-board listing since late 2024 (227 on 14 Nov 2026): how much each share gained or lost on listing day, and where it stands today against its issue price. And since 14 Nov 2026 it links each company to its own IPO page at /ipo/<symbol>/, with subscription by investor group, the listing day and returns after listing.
A new box, What past IPOs tell you, sums up the record of NSE main-board IPOs and links to the full IPO performance study, which has its own tutorial.
One line to remember: 70% of the 227 main-board IPOs since October 2024 opened above their issue price, but half closed their first day below the opening price and 72% traded below the issue price at some point after listing. A listing gain is not the same as a good investment.
How an IPO works: the words you will see
| Term | Meaning |
|---|---|
| Price band | The range within which you can bid, e.g. ₹88 to ₹94. Most retail investors bid at the top (the “cut-off”). |
| Issue price | The final price fixed after bidding closes, usually the top of the band. |
| Lot size | The minimum number of shares you can apply for; you apply in multiples of it. |
| Retail investor | An individual applying for up to ₹2 lakh. A fixed share of each issue is reserved for this category. |
| QIB / NII | Qualified institutional buyers (mutual funds, insurers, banks, foreign investors) and non-institutional investors (bids above ₹2 lakh). Each group has its own portion. |
| Subscription | Demand versus shares on offer. “50 times subscribed” means bids for 50 times the shares available. It is reported for each investor group and in total. |
| Allotment | Who actually gets shares. In an oversubscribed issue, retail allotment is by lottery, one lot per lucky applicant. |
| Anchor investors | Large institutions that commit before the issue opens. Their shares are locked in for a period after listing. |
| Listing day | The first day of trading, normally three working days after the issue closes (T+3). |
| Listing gain | The opening price on listing day against the issue price. |
| Main board vs SME | Main-board IPOs list on NSE’s main market. SME IPOs list on the NSE Emerge platform, with larger minimum applications and thinner trading. The scorecard and the “What past IPOs tell you” box cover main-board IPOs only. |
The life of an IPO
- Announcement: the company files its offer document (DRHP, then RHP) with SEBI. It contains the business, the risks and the use of money. Read the risk factors.
- Bidding: the issue is open for usually three working days. You apply through your broker or bank (ASBA/UPI); the money is blocked, not taken. The IPO’s ChartMine page shows subscription by group as NSE reports it.
- Allotment: shares are allotted; unallotted money is unblocked.
- Listing: trading starts with a special pre-open session that discovers the opening price.
About the grey market premium (GMP)
You will often hear about a GMP, a price at which IPO shares are said to change hands unofficially before listing. ChartMine does not publish GMP. It is not traded on any exchange, nobody regulates it, the numbers cannot be verified, and it can be quoted to move sentiment. The calendar and the IPO pages use only NSE data.
Why use the IPO calendar: advantages and limits
✅ Dates in one place
Open, upcoming and recently listed issues on NSE, with dates, price band and size.
✅ Honest track record
Every main-board listing since late 2024, winners and losers, so you see the real odds instead of only the headlines.
✅ A page for every IPO
Click any name for its subscription by group, listing day, chart against the issue price and returns compared with NIFTY 50.
✅ Adjusted prices
Returns are adjusted for later bonus issues and splits, so a split does not look like a crash.
What 227 main-board listings tell us
We analysed the main-board listings in the scorecard on 14 Nov 2026 (closing prices to 13 Nov 2026): 227 IPOs from 22 Oct 2024 (Hyundai Motor India) to 5 Nov 2026.
| Measure | Result |
|---|---|
| Opened above the issue price | 160 (70%); 47 opened below, 20 flat |
| Average / median listing gain at the open | +14.0% / +7.6% |
| Opened 50% or more higher | 18 (8%) |
| Opened 10% or more lower | 14 (6%) |
| Closed day one below the opening price | 114 (50%) |
| Above the issue price on 13 Nov 2026 | 137 (60%); median return since issue +18.6% |
| Above the listing-day opening price on 13 Nov 2026 | 113 (50%) |
Split by how they listed:
| Listing gain | Listings | Above issue price now | Above listing-day open now |
|---|---|---|---|
| 30% or more | 44 | 89% | 52% |
| Between 0% and 30% | 116 | 61% | 53% |
| 0% or less | 67 | 40% | 43% |
And by the year of listing (2024 covers only the last ten weeks of that year):
| Listed in | Listings | Opened above issue | Average listing gain | Above issue on 13 Nov 2026 |
|---|---|---|---|---|
| 2024 (from 22 Oct) | 25 | 76% | +27.8% | 64% |
| 2025 | 97 | 70% | +9.7% | 49% |
| 2026 (to 5 Nov) | 105 | 70% | +14.7% | 70% |
The 2026 listings look better on “above issue now” partly because they have had less time to fall or rise: a young listing is still close to its listing price. The older the listing, the more its result depends on the business rather than on listing-day demand.
- If you were allotted at the issue price, a strong listing usually stayed profitable: 89% of the big listers were still above issue.
- If you bought on listing day at the open, it was close to a coin toss: only 52% of the big listers were higher than their opening price later.
- Weak listings rarely recovered: only 40% of IPOs that opened flat or lower were above their issue price on 13 Nov 2026.
Limits. This covers two years of one market phase. Allotment is a lottery, so most retail applicants in hot issues get nothing, and the listing gains above are not returns you could count on earning. Past listings do not predict the next one.
A tour of the IPO calendar
Open the IPO calendar. The top shows four numbers, then the new summary box, the open and upcoming issues, the last 30 listings and the full scorecard.

- 1IPOs open or coming up on NSE
- 2Share of recent main-board listings that opened above the issue price
- 3Average listing gain at the opening price
- 4Share still above the issue price today
On 14 Nov 2026 the first box showed 0: NSE’s issue list had no open or upcoming IPO that day. The other three boxes cover the same 227 main-board listings as the study: 70% opened above the issue price, the average listing gain was +14.0% and 60% were above the issue price. When issues are open, the Current and upcoming IPOs table lists each one with its status, dates, price band and the number of shares offered, and each open issue has its own page with live subscription.
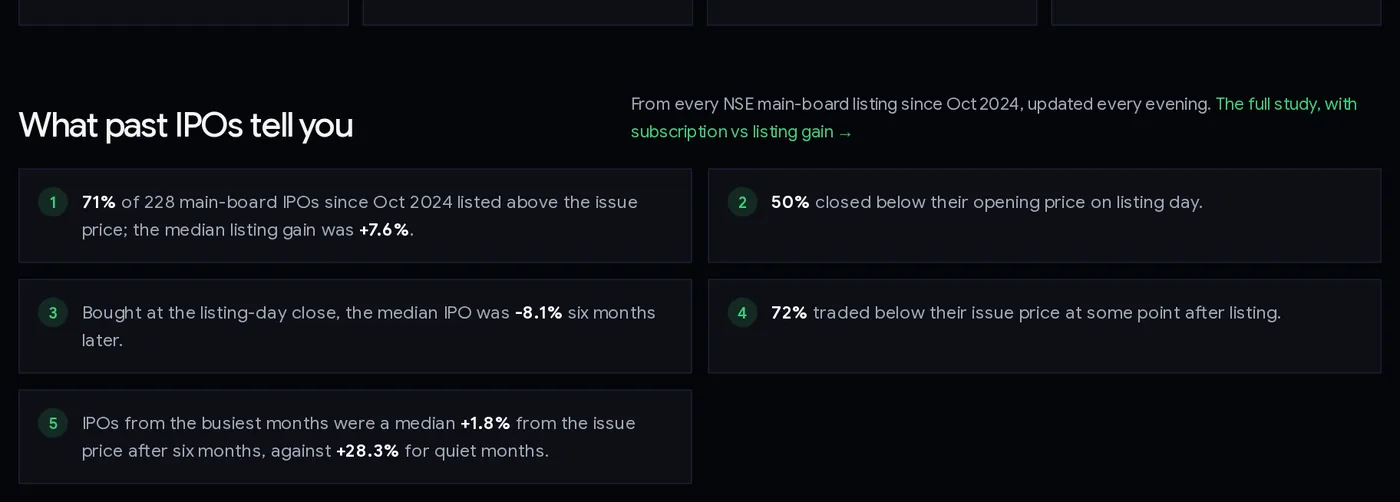
The What past IPOs tell you box gives five facts from the 227 main-board IPOs, refreshed every evening: the share that listed at a premium and the median listing gain (+7.6%), the share that closed day one below the open (50%), what a listing-day buyer saw six months later (median -7.9%), how many dipped below the issue price (72%), and how IPOs from busy months compared with quiet months (+1.8% against +30.0% from the issue price after six months). The link at the top opens the IPO performance study.
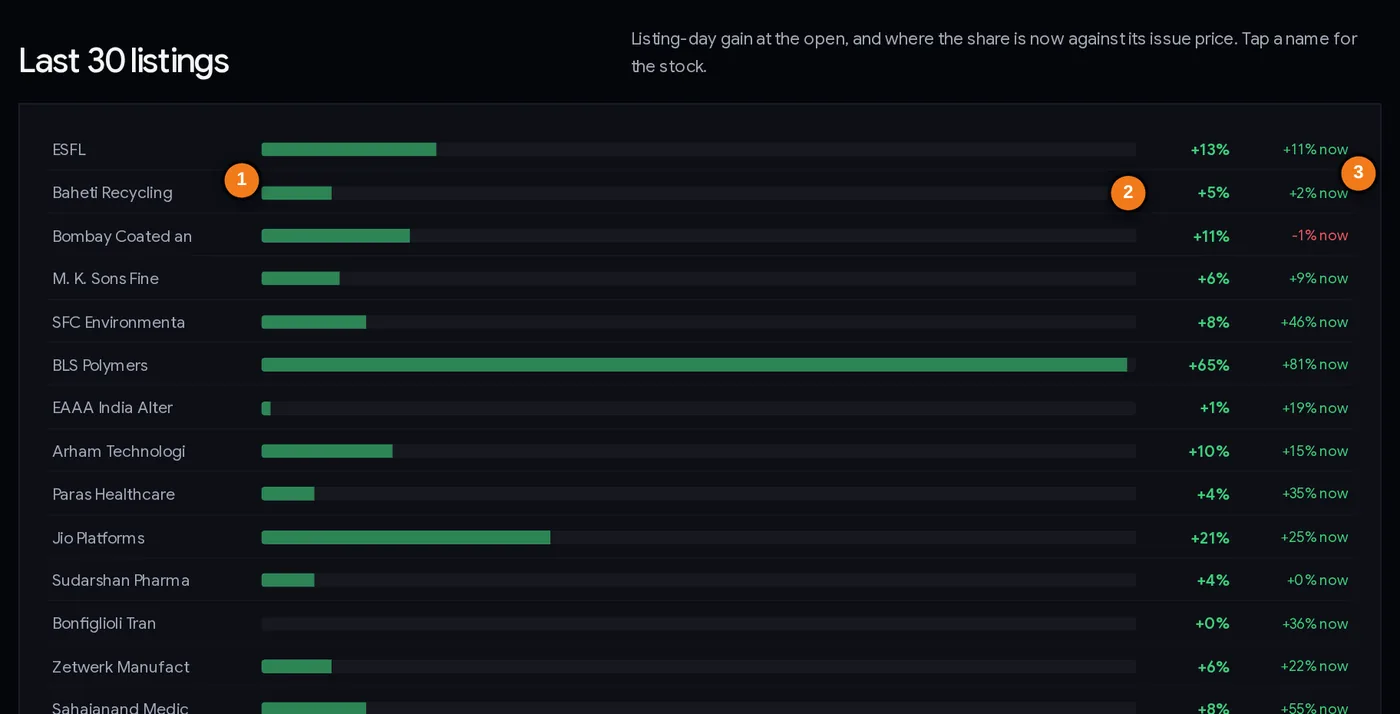
- 1Company
- 2Listing gain at the open (the bar shows its size)
- 3Where the share is now against the issue price
The Last 30 listings card is the quickest read of recent mood. The bar length shows the listing gain; the coloured figure on the right shows the return since issue today. On 14 Nov 2026 Tonbo Imaging India had opened 66% above its issue price and stood 120% above it; Vishal Nirmiti had opened 2% below and stood 45% below. Tap a name to open that IPO’s page.
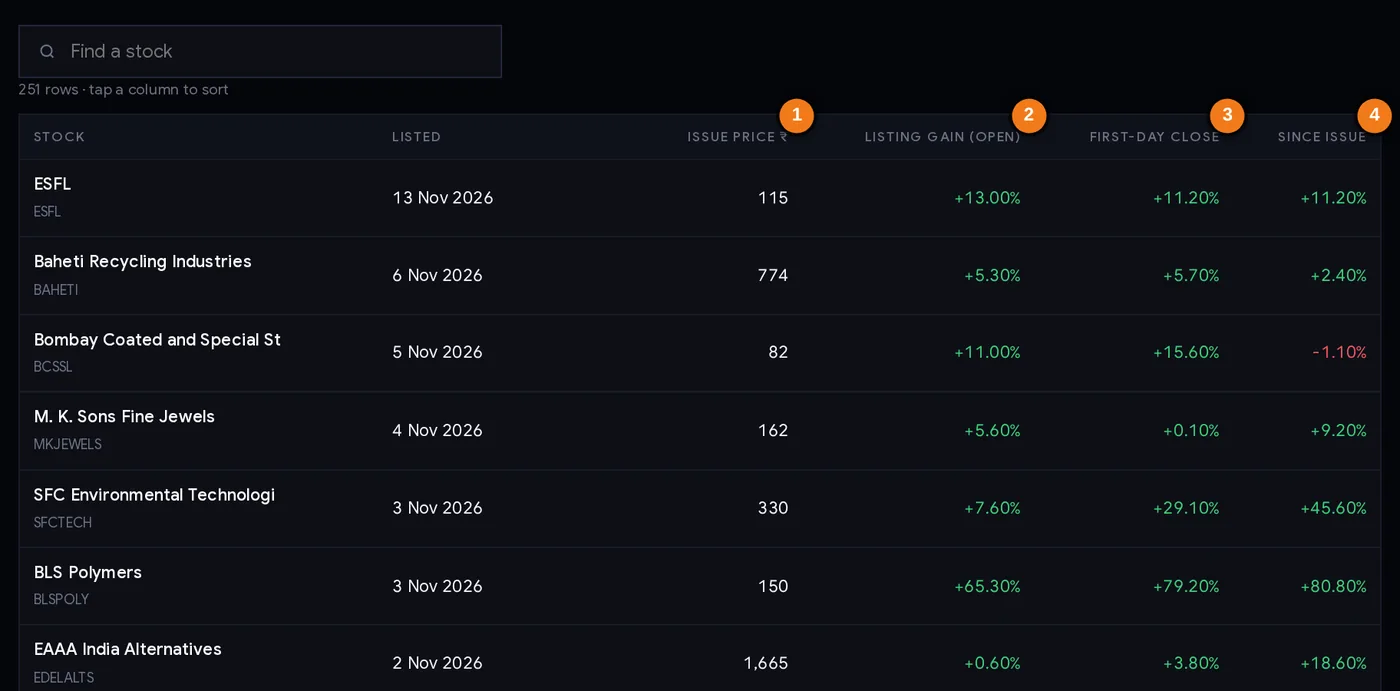
- 1Issue price
- 2Listing gain at the opening price
- 3First-day close against the issue price
- 4Return since issue, now
| Column | What it tells you |
|---|---|
| Stock / Listed | Company, NSE symbol and listing date. Click the name to open its IPO page (/ipo/<symbol>/). |
| Issue price ₹ | The IPO price at which shares were allotted. |
| Listing gain (open) | Opening price on listing day against the issue price. |
| First-day close | Closing price on listing day against the issue price. Compare with the listing gain to see whether the first day faded or extended. |
| Since issue | The latest price against the issue price, adjusted for later bonus issues and splits. |
Use the search box to find one company and click a column header to sort, for example by “Since issue” to see the best and worst performers.
IPO pages and stock pages
Each IPO page, for example Tonbo Imaging India, shows the issue facts, subscription for QIB, NII, retail and employees, the listing day, a chart against the issue price and returns from 1 week to 1 year next to NIFTY 50 and the median IPO. A recently listed stock also gets a regular stock page from its 5th trading session, if it trades enough, with an IPO section near the top: issue price, subscription, listing gain and return since the IPO, with a link to the full IPO page. On 14 Nov 2026 the Tonbo stock page showed that its listing gain beat 96% of the 227 main-board IPOs.
Step by step: evaluating an IPO (30 minutes)
- Check the calendar for open and upcoming issues: dates, price band, size, main board or SME.
- Open the IPO’s own page from the calendar and note the lot size and subscription by group as it builds up.
- Read the offer document (RHP) on SEBI’s or the exchange’s website: business, financials, risk factors, and how much is fresh issue versus offer for sale.
- Compare the valuation with listed peers. Use the compare stocks tool and the peers’ PE on the stock screener.
- Look at the record. Read the “What past IPOs tell you” box, then the subscription table on the IPO performance page, and check how recent IPOs in the same sector did in the scorecard.
- Decide your amount as if allotment were certain and the share fell 20% on day one. Could you hold through that?
- Apply only with money you can block for the bidding period, through ASBA/UPI.
- If allotted, plan listing day before it starts: will you sell, hold, or sell part? Write it down.
- After listing, revisit the IPO page to see how your decision compared with NIFTY 50 and the median IPO.
Three ways people approach IPOs
Approach A: the long-term investor
Treats an IPO like any other share purchase: applies only to businesses they would want to own at that valuation, holds through listing-day noise, and often waits for the first results as a listed company. The scorecard’s “since issue” column is the number that matters here.
Approach B: the listing-day seller
Applies to issues expecting a pop and sells on listing day. In our data 70% of main-board IPOs opened above issue, but only 8% opened 50% or more higher and 6% opened 10% or more lower. With lottery allotment, most applications in popular issues get nothing. Anyone using this approach should decide in advance what to do if the share opens below the issue price.
Approach C: wait for the listing, then judge
Skips the application and studies the share after it lists: first results, lock-in expiries, price behaviour. Our data shows why some prefer this: 50% of main-board listings closed day one below their opening price, and only 50% were above that opening price on 13 Nov 2026. Patience often offered a lower entry, though not always. Any purchase still needs a stop loss and a position size from the position size calculator.
No approach is risk-free. New listings can be very volatile. ChartMine is not a SEBI-registered adviser and this is education, not a recommendation to apply for any IPO.
Case studies from the scorecard
All from the scorecard and IPO pages on 14 Nov 2026 (closing prices to 13 Nov 2026, adjusted for later bonus issues and splits).
1. Swiggy (listed 13 Nov 2024): a good first day, a hard two years
Issue price ₹390, subscribed 3.59×. Opened 7.7% higher and closed day one 16.9% up. On 13 Nov 2026 it stood 52.1% below its issue price. Lesson: a strong listing day says nothing about the following years.
2. Hyundai Motor India (22 Oct 2024) and Lenskart (10 Nov 2025): weak starts
Hyundai, issue ₹1,960, opened 1.3% lower and closed day one 7.2% down; on 13 Nov 2026 it was 5.9% above issue. Lenskart, issue ₹402, opened 1.7% lower; on 13 Nov 2026 it was 80.8% above its issue price. Lesson: a flat or negative listing is not a verdict on the business, even if, across all IPOs, weak listings recovered less often.
3. Orient Cables vs Tonbo Imaging (October 2026): two big pops
Orient Cables (issue ₹272, listed 5 Oct 2026) opened 65.4% higher, closed day one at +48.9% and stood at +50.3% on 13 Nov 2026: a gain for allottees, but below the listing-day opening price. Tonbo Imaging India (issue ₹700, listed 23 Oct 2026, subscribed 136×) opened 65.7% higher and stood at +119.8%. Lesson: same listing gain, different paths for someone who bought at the open.
4. HDB Financial Services (2 Jul 2025) and AceVector (5 Oct 2026): losses for different buyers
HDB Financial (issue ₹740, subscribed 16.7×) opened 12.8% higher but was 23.5% below issue on 13 Nov 2026. AceVector (issue ₹32) opened 11.5% lower, closed day one 18.5% down and was 33.3% below issue. Lesson: IPOs can lose money for allottees too, and averaging down into a falling new listing can deepen the loss.
Common mistakes
- Treating a listing gain as certain. 47 of 227 recent main-board listings opened below the issue price.
- Relying on GMP. It is unofficial, unregulated and unverifiable; ChartMine does not publish it.
- Looking only at total subscription. Check QIB, NII and retail separately on the IPO page.
- Applying with borrowed money or money you need soon.
- Buying at the listing-day open on excitement. 50% closed the first day below the open.
- Skipping the offer document. The risk factors are written for you.
- Applying in many names to raise odds in ways that break the rules (one application per PAN).
- Confusing SME and main-board IPOs. SME shares are smaller, thinner and riskier, and the scorecard does not cover them.
IPO checklist
- I know the dates, price band, lot size and whether it is main board or SME.
- I have opened the IPO’s page and looked at subscription by investor group.
- I have read the business, financials and risk factors in the offer document.
- I know how much is fresh issue and how much is existing owners selling.
- I have compared the valuation with listed peers.
- I have checked how recent similar IPOs have done on the scorecard and the IPO performance page.
- The amount I apply with could fall 20% without hurting me.
- I have decided my listing-day plan in advance.
- I am not relying on GMP or tips.
Glossary
| IPO | Initial public offering: a company’s first sale of shares to the public. |
| Fresh issue / OFS | New shares (money to the company) / existing owners selling (money to them). |
| Price band | The bidding range; the issue price is fixed within it. |
| Lot size | The minimum number of shares per application. |
| Subscription | Bids received ÷ shares offered, for each investor group and in total. |
| Allotment | Shares actually given to applicants. |
| Listing gain | Listing-day opening price versus issue price. |
| Lock-in | A period after listing in which certain holders (anchors, promoters) cannot sell. |
| GMP | Grey market premium: an unofficial, unregulated pre-listing price. Not provided by ChartMine. |
| RHP | Red herring prospectus: the offer document with full details of the issue. |
| SME IPO | A small-company IPO on the NSE Emerge platform. |
| IPO page | ChartMine’s page for one IPO at /ipo/<symbol>/: subscription, listing day and returns after listing. |
Questions
Which IPOs are open now on NSE?
The IPO calendar lists IPOs open or upcoming on NSE with dates, price band and size, and each one has its own page with live subscription. On 14 Nov 2026 NSE’s list showed no open or upcoming IPO; the scorecard shows the latest listings.
How have recent IPOs performed on listing day?
Of 227 NSE main-board IPOs from 22 Oct 2024 to 5 Nov 2026, 70% opened above the issue price, with an average listing gain of 14.0% and a median of 7.6%. 60% were above the issue price on 13 Nov 2026.
What is the listing gain of an IPO?
The difference between the price at which the share first trades on listing day and the IPO issue price, as a percentage of the issue price.
Does ChartMine show IPO GMP?
No. The grey market premium is unofficial, unregulated and cannot be verified. ChartMine uses only NSE data: the issue list, subscription as NSE reports it and prices after listing.
How many days after an IPO closes does it list?
Main-board IPOs normally list three working days after the issue closes (T+3).
Where can I see an IPO’s subscription and returns after listing?
Click the company’s name in the IPO calendar to open its ChartMine IPO page at /ipo/