
☰ All tutorials
Start here
Tool tutorialsHow to trade with ChartMineStocks
Stock monitorMy watchlistStock scores & checklistMarket & sectors
Nifty 50Bank NiftySensexFin NiftyDaily market reportMarket breadthSector rotationSector heatmapStock screenerRelative strength (RS)MCX commodity pricesFear & Greed IndexWhat happens after…Scanners
Top gainers & losersStocks to watch tomorrowNR7 stocks scannerInside bar stocks52-week high stocksGap up & gap down stocksRSI oversold stocksGolden cross stocksSuperTrend buy stocksScan builderEMA 9/21 crossoverMACD crossoverADX strong trendBollinger breakout / squeezeVolume spike stocksOpen = high / open = lowCandlestick pattern scannerNarrow CPR scannerF&O data
F&O ban listOI build-upOption chainPCR & max painExpiry calendarF&O lot sizesOI build-up heatmapPCR trendMax pain trendFutures basisStock screens
Quarterly growersProfit growth stocksLow P/E stocksMutual fund buyingNear 52-week low, growingDebt-free companiesHigh ROE & ROCEMagic Formula stocksLow price-to-bookSmart money
FII / DII dataShareholding changesBig-money footprintShort selling dataF&O positions by participantBulk & block dealsPromoter buyingDelivery percentageCalendars
Results calendarQuarterly results trackerBoard meetingsCorporate actionsIPO calendarIPO performanceResearch & planning
Strategy testerCompare stocksDividend yield stocksASM / GSM listExpiry-day movesSeasonality & stock historyNSE holidays 2026Position size calculatorOption payoff calculatorPivot point calculatorMore
Stock scanners hubStock screensHow to use the stock screener
A beginner-friendly guide to screening Indian stocks: what every number means, the eleven ready-made screens, the More filters panel, saving a screen and downloading a CSV, how to read the table and the growth-versus-valuation map, four playbooks, real case studies and an honest look at whether screens beat the market.
What a stock screener is, in plain words
NSE has well over a thousand actively traded companies. Nobody can read the results of all of them every quarter. A stock screener is a filter: you tell it the numbers you care about, such as “profit growing at least 25%” or “price less than 15 times earnings”, and it hides every company that does not pass. What is left is a short list you can actually study.
Think of a property website: you set the budget and area, and it shows 40 flats instead of 40,000. You still visit before you buy. A screener narrows the search; it does not make the decision.
The ChartMine stock screener covers 1,448 NSE stocks (prices of 13 Nov 2026). For each one it shows the company’s fundamentals (what the business earns and who owns it) next to its price strength (how the share has performed). You can type limits in any box, or press one of eleven ready-made screens. A More filters button opens 13 extra boxes, such as ROE, debt and price-to-book.
One line to remember: a screen gives you a list of companies to research, not a list of shares to buy. ChartMine is not a SEBI-registered adviser, and nothing on the screener is a recommendation.
New to the numbers? The next section explains each with a real example.
The numbers in the screener, explained
Fundamentals come from company filings with NSE (quarterly results, half-yearly balance sheets, quarterly shareholding); prices from NSE’s daily files.
| Number | What it means | Real example (13 Nov 2026 prices) |
|---|---|---|
| Market cap | Price × number of shares, in ₹ crore (1 lakh crore = 1,00,000 crore). | HDFC Bank: ₹12,39,655 Cr. Foseco India: ₹4,746 Cr. |
| P/E ratio | Price ÷ earnings per share (EPS) of the last four quarters. Loss-makers have no P/E. | Coal India 7.5, HUL 31.1, DMart 71.9. |
| Revenue / Profit YoY | Latest quarter’s sales (total income for lenders) and net profit versus the same quarter a year earlier. Profit growth is empty when last year’s quarter was a loss. | TCS revenue +11.2%; SBI profit +19.7%. |
| Net margin | Profit ÷ revenue, latest quarter. | Hindustan Zinc 42.5%, DMart 3.8%. |
| ROE | Return on equity: last four quarters’ profit ÷ average shareholders’ equity. How hard the owners’ money works. | TCS 45.8%, SBI 14.4%, Reliance 9.0%. |
| ROCE | Return on capital employed: profit before interest and tax ÷ (equity + borrowings). Not shown for banks and lenders. | Coal India 34.3%, NTPC 9.2%. |
| Debt / equity (D/E) | Borrowings ÷ equity. 0 = no debt. Not shown for banks. | HUL 0.00, L&T 1.21. |
| Price / book (P/B) | Price ÷ book value (equity) per share. Below 1 = valued under its net assets on paper. | ONGC 0.71, SBI 1.44, Nestle India 42.16. |
| Promoter % | Share of the company owned by the founders or parent group. | TCS 71.8%. HDFC Bank 0, because it has no promoter group. |
| FII % / FII chg | Foreign investors’ stake and its change in points between the last two quarterly filings. | Welspun Corp FII change +8.48 points. |
| MF % / MF chg | Indian mutual funds’ stake and its change, in points. | Coal India MF change +1.84 points. |
| RS rating | 12-month return (latest quarter counted twice) ranked 1 to 99 against all stocks. | Cupid 99, Policybazaar 4. |
| 1 year / 1M / 3M | Price change over the last year (about 250 trading days), one month and three months. | Welspun Corp +142.3% in a year. |
| From 52-week high | % below the past year’s high. 0 = at the high. | ICICI Bank −2.0%. |
| Delivery / volatility | Delivery: share of volume taken into demat accounts (60-day average). Volatility: typical yearly price swing. | Reliance 57% delivery; Castrol India volatility 15%. |
Why “points” and not “percent” for holding changes
If mutual funds owned 10% of a company and now own 11%, their stake rose by 1 point (a “10% increase” sounds much bigger). The screener always uses points, also for the promoter and retail change boxes.
Why P/E and P/B must be compared within a sector
With prices of 13 Nov 2026 the median P/E of the 1,289 stocks with one was 26.8. But sectors differ: from the screener’s own data, the median P/E was about 12.0 for oil & gas, 17.1 for financial services, 23.5 for FMCG and 41.1 for pharma & healthcare. A P/E of 20 is expensive for a bank and cheap for a consumer brand. P/B too: banks and PSUs often trade near book value, brands at many times it.
The eleven ready-made screens (types of screen)
Each button fills the boxes for you (the new ones also fill boxes inside More filters). The counts are from the screener on 14 Nov 2026 (prices of 13 Nov).
| Screen | Rule | Stocks | The idea behind it |
|---|---|---|---|
| Growth | Profit YoY ≥ 25% and RS ≥ 70 | 269 | Fast-growing profits and a strong share price. |
| Value | P/E ≤ 15 and profit growing | 198 | Cheap on earnings, but not shrinking. |
| FIIs buying | FII stake up ≥ 0.5 points | 261 | Where foreign investors added last quarter. |
| Mutual fund favourites | MF holding ≥ 10% | 434 | Companies Indian funds already own in size. |
| Big & cheap | Market cap ≥ ₹20,000 Cr and P/E ≤ 20 | 79 | Large companies at modest valuations, e.g. SBI, TCS, Infosys, LIC. |
| Promoter-heavy | Promoters ≥ 70% | 315 | Founders or parents with a large stake (PSUs appear too). |
| High margin | Net margin ≥ 20% and revenue growing | 165 | A large slice of each sale kept as profit, e.g. Bajaj Finance, HAL. |
| Quality compounders (new) | ROE ≥ 20%, debt/equity ≤ 0.5, profit growing | 190 | High returns on capital without much borrowing, e.g. TCS, HUL, Infosys, HCL Tech, HAL. Median P/E of the list: 29.7. |
| Debt-free & profitable (new) | Debt/equity ≤ 0.1 and ROE ≥ 12% | 307 | Companies that fund themselves. Most came from capital goods (71), pharma (43) and auto (25). |
| Cheap on book (new) | P/B ≤ 1.5 and ROE ≥ 12% | 79 | Priced near their net assets but still earning a decent return, e.g. SBI, NTPC, ONGC, Hindalco. 26 of the 79 were financial companies. |
| Growth with momentum (new) | Profit YoY ≥ 15% and 3-month return ≥ 15% | 134 | Growing profits and a rising share price, e.g. Kotak Bank, Divi’s Labs, Laurus Labs. Median RS of the list: 91. |
Presets are starting points: press one, then add a limit of your own, such as market cap min 5,000. Press it again to clear it.
Banks drop out of the debt screens. Debt/equity and ROCE are not calculated for banks, because deposits are their raw material. Only 25 of 167 financial companies (mostly NBFCs) have a D/E number, so SBI, HDFC Bank and ICICI Bank never appear in Quality compounders or Debt-free & profitable. Screen banks with ROE and P/B.
Growth, value and quality: the three classic styles
- Growth: fast-rising profits at a higher P/E. Risk: paying too much if growth slows.
- Value: priced low against profits or assets. Risk: low for a reason (a “value trap”).
- Quality: high ROE, low debt, steady results. Risk: rarely cheap.
The screener lets you mix them. A common blend is “growth at a reasonable price”: profit growth above 20%, revenue growth above 15%, P/E below 25. With prices of 13 Nov 2026 that blend, with market cap above ₹5,000 crore, gave 89 stocks.
Why use a screener: advantages and limits
✅ Saves days of work
Checking 1,448 companies by hand is impossible; the screener does it in a second.
✅ Removes bias
You see every company that passes your rules, not only those in the news.
✅ Business and price together
Fundamentals sit next to RS rating and 1-year return, so you see if the market already noticed.
✅ Save, share, export
Filters live in the page address, so a link reopens the same screen. Save screens by name in your browser, or download the list as a CSV.
The limits (read this part)
- Numbers are backward-looking. Every figure describes a quarter that has already ended. Share prices look forward.
- One quarter can mislead. A one-time gain (selling land, a tax write-back) can make profit jump. Revenue growth is harder to fake, so check both.
- Filings sometimes contain errors. On 9 Nov 2026 the Value screen showed a company with a net margin of 860%, impossible for a normal business. If a number looks impossible, open the filing.
- Balance-sheet numbers are half-yearly. ROE, ROCE, D/E and P/B use the latest balance sheet filed (30 Sep 2026 for companies that have filed half-year results), so they change in steps; only P/B also moves with the price.
- Missing numbers remove stocks. If you filter on P/E, every loss-making company (159 stocks had no P/E with prices of 13 Nov 2026) drops out, even if it is improving fast.
- Shareholding is quarterly. FII and MF changes compare two quarter-end snapshots, not live buying.
Do the screens beat the average stock? What our data says
We rebuilt four screens on past dates, using only results filed before each date, and measured price changes to 6 Nov 2026 (adjusted for splits and bonuses), against the median NSE stock with fundamentals and market cap of ₹500 crore or more.
| Screen, start date | Stocks | Median change | All stocks |
|---|---|---|---|
| Sales and profit up 3 quarters running, 17 Feb 2026 | 63 | +11.1% | +0.6% |
| Profit up 25%+ YoY, 1 Jun 2026 | 393 | +0.9% | −1.5% |
| P/E under 15 with growth, 1 Jun 2026 | 92 | −0.4% | −0.6% (stocks with a P/E) |
| Mutual funds +0.5 points, 22 Apr 2026 | 247 | −0.7% | −1.9% |
Only the steady-growth screen clearly did better; the others were roughly in line with the market. Five to nine months in one market phase prove nothing. A screen narrows your list; your research on the list is what matters.
A tour of the screener screen
Open the stock screener. From top to bottom: summary tiles, search and presets, filter boxes, the More filters / Save / Download row, a growth-versus-valuation map and the results table. On 14 Nov 2026 the tiles read: 1,448 stocks covered, 1,289 with a P/E (median 26.8), 1,420 with shareholding data, 269 passing the Growth screen.
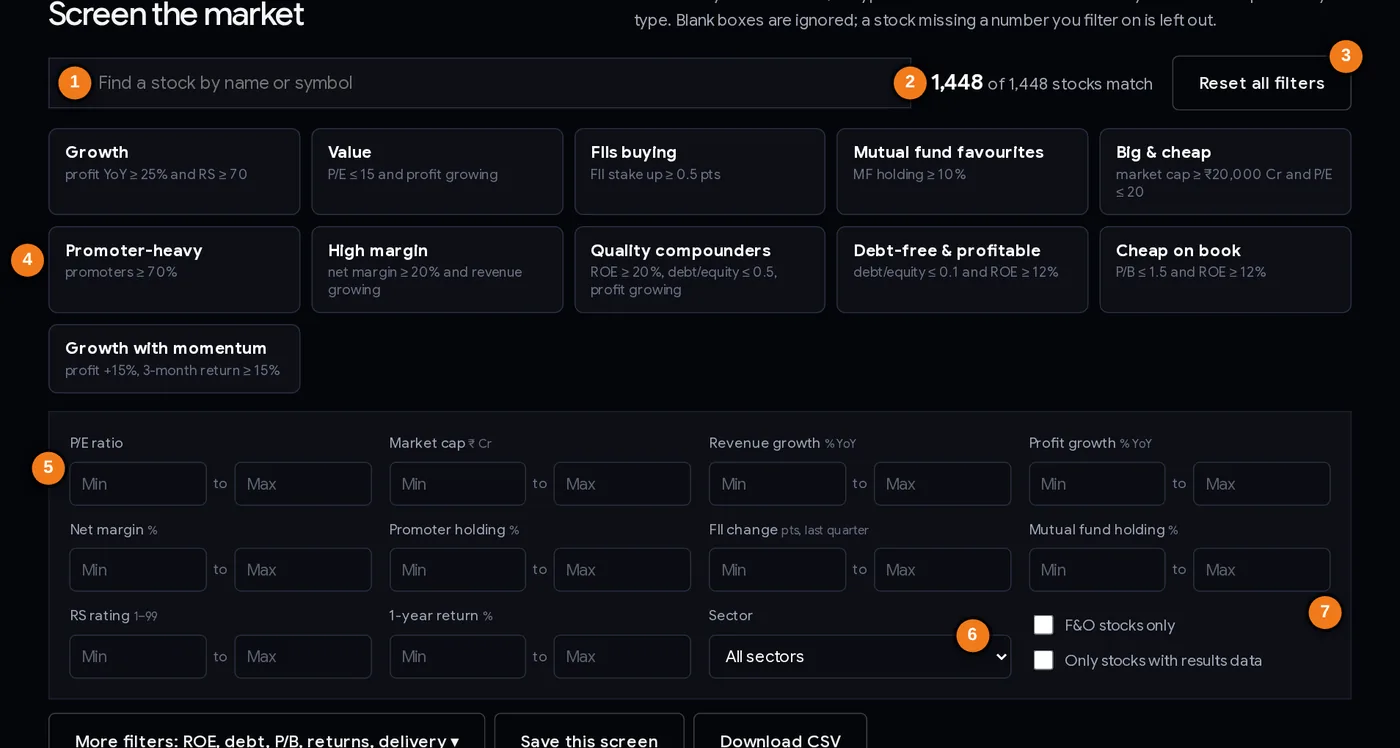
- 1Find a stock by name or symbol.
- 2How many stocks match, and how many filters are on.
- 3Reset all filters.
- 4Eleven ready-made screens: one press fills the boxes.
- 5Min / max boxes for P/E, market cap, growth, margin, holdings, RS and 1-year return.
- 6Sector.
- 7F&O stocks only / only stocks with results data.
How the filters work
- Each box has a Min and a Max. Fill one or both. Blank boxes are ignored.
- Results update as you type. The count next to the search box tells you how many stocks match and how many filters are on.
- A stock missing a number you filter on is left out (for example, a company with no P/E when you set a P/E limit, or a bank when you set a debt/equity limit).
- Sector limits the list to one sector. F&O stocks only keeps the most liquid names. Only stocks with results data hides companies without fundamentals.
- Reset all filters clears everything, including the boxes in More filters.
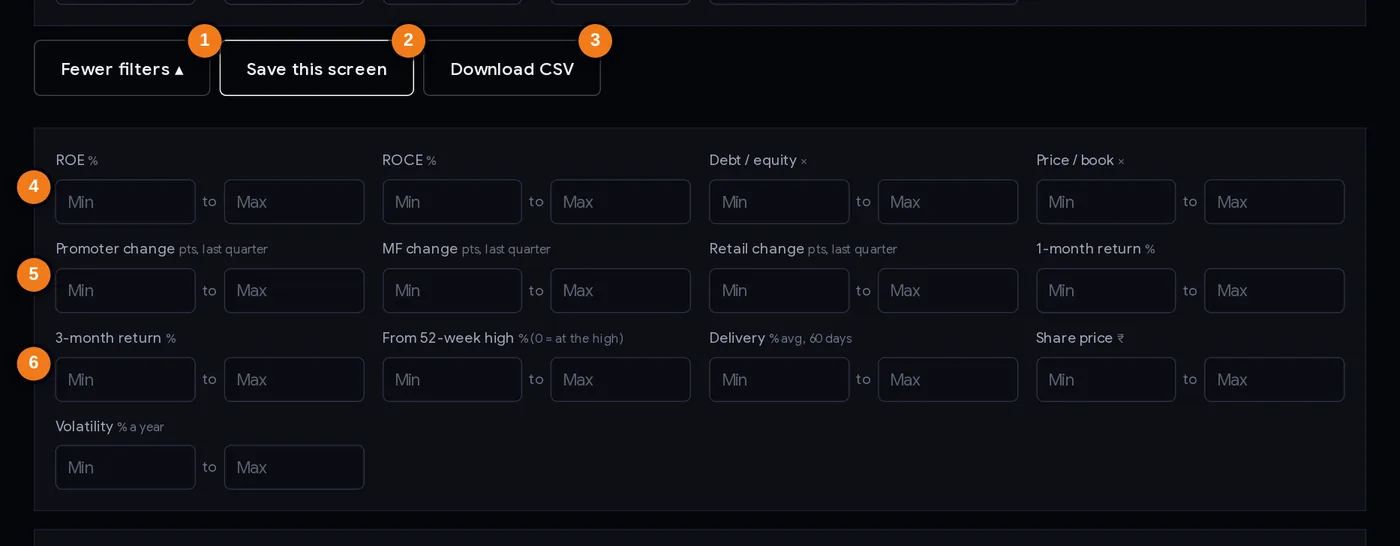
- 1More filters / Fewer filters.
- 2Save this screen by name (this browser only).
- 3Download the full list as a CSV file.
- 4Quality and valuation: ROE, ROCE, debt/equity, price/book.
- 5Stake changes in points (promoter, MF, retail) and 1-month return.
- 63-month return, distance from the 52-week high, delivery, share price, volatility.
More filters, saved screens and CSV
| Control | What it does |
|---|---|
| More filters | Opens 13 more Min/Max boxes: ROE, ROCE, debt/equity, price/book, promoter, MF and retail change (points), 1-month and 3-month return, distance from the 52-week high, delivery %, share price and volatility. Fewer filters folds them away; they stay active. |
| Save this screen | Asks for a name and keeps the current filters as a button under the row. Press the name to reload it with today’s data; × deletes it. Saved only in this browser on this device, never on our server. |
| Download CSV | Downloads every stock that matches (not just the 50 rows on screen) as chartmine-screen.csv, with all the numbers, to open in Excel or Google Sheets. |
Careful: From 52-week high is negative, so “within 10% of the high” is Min −10. A big rise in retail change while funds sell is often read as a warning, not a strength.
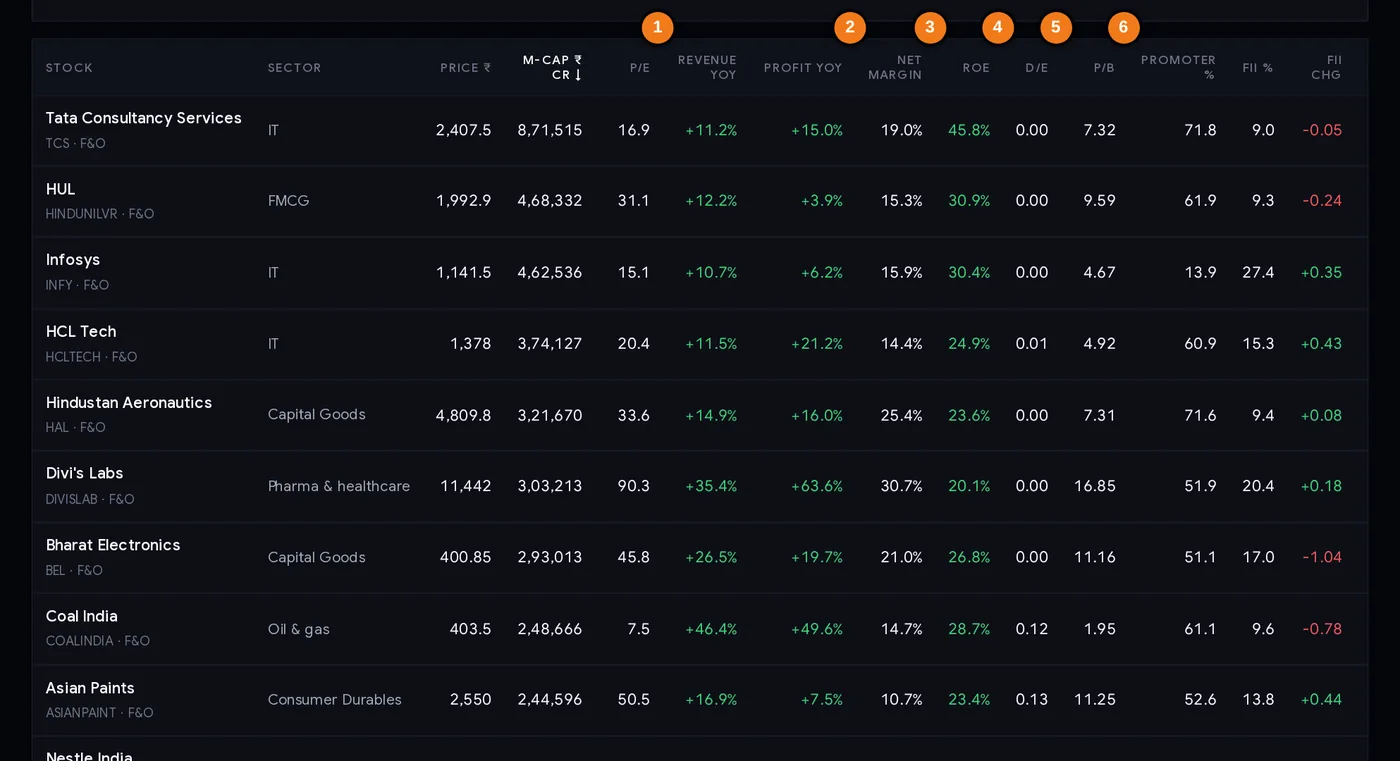
- 1P/E: price ÷ last four quarters’ EPS.
- 2Profit growth on a year ago.
- 3Net margin, latest quarter.
- 4ROE: return on equity (green at 15% or more).
- 5D/E: debt to equity.
- 6P/B: price to book value.
Every column of the table
| Column | How to read it |
|---|---|
| Stock / Sector | Name, symbol, “F&O” if it has derivatives; click for the stock page. NSE sector (“–” = not classified). |
| Price ₹ / M-cap ₹ Cr | Last close and market value in crore. |
| P/E | Price ÷ last four quarters’ EPS. Lower is cheaper on today’s profits. |
| Revenue YoY / Profit YoY | Latest quarter versus a year earlier. Green up, red down. |
| Net margin | Profit as % of revenue, latest quarter. |
| ROE / D/E / P/B | Return on equity (green at 15% or more, red if negative), debt to equity and price to book. “–” when not calculated, e.g. D/E for banks. |
| Promoter % / FII % / MF % | Who owns the company, from the latest shareholding filing. |
| FII chg / MF chg | Change in points since the previous quarter’s filing. |
| RS | 1–99. Green badge for 70 or more, red for 30 or less. |
| 1 year / Delivery | Price change over a year; delivery % of volume. |
Click a header to sort; click again to reverse. On a narrow screen, scroll the table sideways. “Show 50 more” adds rows.
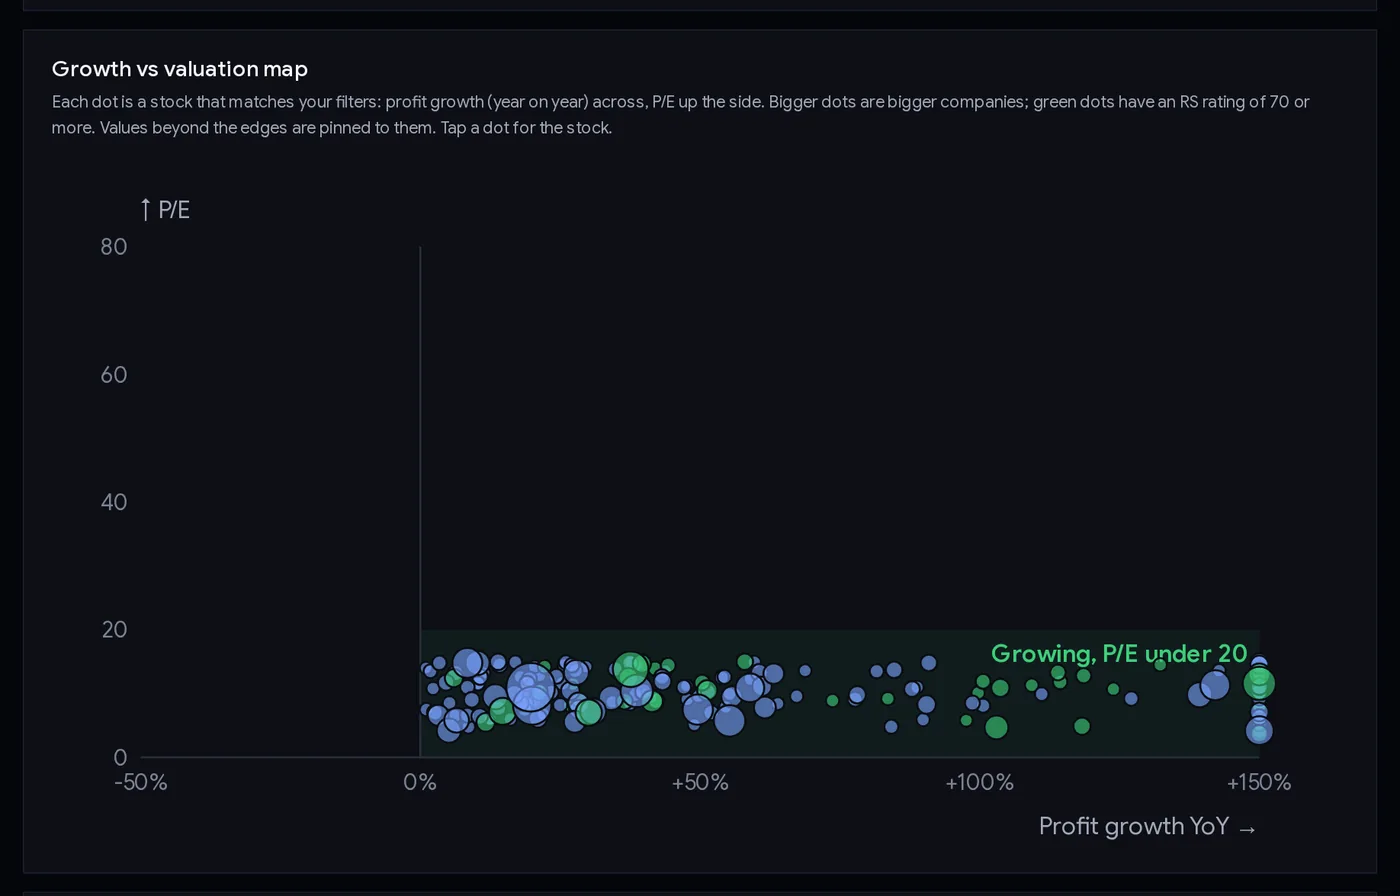
The growth vs valuation map puts every matching stock on one picture: profit growth across, P/E up the side. The green shaded box is “growing, P/E under 20”. Big dots are big companies; green dots have RS 70 or more. Values beyond the edges are pinned to them. Tap a dot to open the stock.
Step by step: your first screen (20 minutes)
- Decide what you are looking for before you touch a box. E.g. “large, profitable companies growing faster than 15% that are not expensive”.
- Turn the sentence into limits. For the example: market cap min 20,000; revenue growth min 15; profit growth min 15; P/E max 25.
- Add a quality or debt limit if it fits your idea. Open More filters and set, for example, ROE min 15 and debt/equity max 1. Remember banks have no D/E and will drop out.
- Check the count. Ten to forty names is a workable list. Too many? Tighten one limit. Zero? Loosen one, or press Reset.
- Sort by the column that matters most to you, e.g. P/E (lowest first) or profit growth (highest first).
- Look at the map. Dots far right with a low P/E deserve study first, and are also the likeliest to hide a one-off profit.
- Open each stock page. Check the quarterly bars: is growth steady over several quarters or one jump? Compare the P/E with the sector.
- Read the company’s filing for anything odd: a huge margin, a sudden profit jump, a big stake change.
- Save the screen (Save this screen or a bookmark); Download CSV keeps today’s list. Re-run it after the next results season.
Never buy a share only because it passed a screen. Size any position so a large fall would not hurt you; even big companies in our study fell 20–35% within months.
Four playbooks investors use
Playbook A: growth at a reasonable price
Profit growth min 20, revenue growth min 15, P/E max 25, market cap min 5,000. Sort by profit growth. Then drop any name whose growth comes from one quarter only (check the stock page). What remains is a list of growing companies not priced for perfection.
Playbook B: value with a safety check
Press Value, then add revenue growth min 0 and market cap min 2,000. Or press Cheap on book and add debt/equity max 1. A low P/E with shrinking sales is often a trap. Compare each P/E with its sector median: a bank at P/E 10 is ordinary, an FMCG company at P/E 10 is unusual and needs a reason.
Playbook C: follow the institutions, carefully
Set MF change min 0.5 and MF holding min 5. Sort by MF chg. Funds research deeply, but they also buy for reasons that are not about the company (new fund launches, index changes). Use it as one clue among many. See the mutual fund buying tutorial.
Playbook D: quality compounders
Press Quality compounders (ROE ≥ 20%, debt/equity ≤ 0.5, profit growing), then add market cap min 10,000 and RS min 50. A high ROE kept for years with little debt usually points to a brand, scale or a niche. These rarely look cheap (median P/E 29.7 on 14 Nov 2026); ask whether growth justifies the price, and check ROE over several years on the stock page.
Case studies from real data
1. Hindustan Zinc: a stock that passes almost everything
On 9 Nov 2026 (prices of 6 Nov) Hindustan Zinc showed P/E 11.5, revenue +76.5% and profit +142% for the September 2026 quarter against September 2025, net margin 42.5% and RS 72. It appeared in Growth, Big & cheap and High margin at once. Lesson: a metal producer’s profit moves with metal prices; a low P/E on peak earnings can rise fast if prices fall. Passing many screens is a reason to study, not proof.
2. Cupid: when the price runs ahead of the numbers
Cupid passed the steady-growth rule on 17 Feb 2026: sales rose from ₹56.5 Cr (March 2025 quarter) to ₹93.5 Cr (December 2025) and profit from ₹11.5 Cr to ₹32.8 Cr. By 6 Nov 2026 the share had risen about 294% from 17 Feb (adjusted for its 4:1 bonus issue on 9 Mar 2026). Profits kept growing, but the P/E reached 331 (298.9 on 13 Nov 2026). Lesson: a great screen result can already be in the price.
3. Godrej Consumer: four good quarters, then a fall
Also a grower on 17 Feb 2026: sales up four quarters in a row (₹3,598 Cr to ₹4,099 Cr) and profit ₹412 Cr to ₹637 Cr. The last step was a 39% jump in one quarter. The next quarter (March 2026) profit was ₹452 Cr, and the share fell from ₹1,214.80 on 17 Feb to ₹851 on 6 Nov 2026 (−29.9%). Lesson: check whether the latest jump is likely to repeat before trusting the trend.
4. HDFC Bank and “promoter 0”
Filter “Promoter holding min 30” and HDFC Bank, ICICI Bank, L&T and ITC all disappear: they have no promoter group (0%). That is not a red flag. Lesson: understand a number before filtering on it.
5. Nestle India and Hindustan Zinc: when a huge ROE needs a second look
With prices of 13 Nov 2026 Nestle India showed ROE 79.9% and Hindustan Zinc 95.4%, both passing Quality compounders. An ROE that high means the equity on the books is small next to the profit; the same small equity explains P/B of 42.16 for Nestle India and 7.82 for Hindustan Zinc. Lesson: a very high ROE can come from a small equity base (for example after years of large payouts or buybacks), not only from a great business. Look at ROCE, debt and the ROE history together.
6. Cheap on book, 13 Nov 2026: what is really in the list
Cheap on book gave 79 stocks. 26 were financial companies, and the large ones were mostly state-owned: SBI (P/B 1.44), NTPC (1.45), ONGC (0.71), Indian Oil (0.87), Punjab National Bank (1.02). The median P/E of the list was 8.2. Lesson: a low P/B often reflects a cyclical business, state ownership or doubts about asset quality. Whether the discount is deserved needs research.
Common mistakes
- Treating the list as a buy list. Our study: most screens did about as well as the average stock over the following months.
- Too many filters. Ten limits give two stocks, both probably with a data quirk. Start with three or four.
- Comparing P/E across sectors. A bank and a pharma company are not comparable on P/E.
- Trusting a huge growth %. +5,000% usually means last year’s profit was tiny (a “base effect”).
- Ignoring loss-makers by accident. Any P/E filter removes them. Fine if intended; know it happens.
- Forgetting the date. Fundamentals change in results season (mid-January, April–May, July–August, October–November). Re-run screens after it.
- No position sizing. Even a well-researched stock can fall 30%. Decide in advance how much of your capital one idea can take.
Checklist before you act on a screen
- I wrote down what I was looking for before screening.
- The list has a workable size (10–40 names).
- For each name, growth is visible over several quarters, not one.
- Revenue grew too, not only profit.
- P/E compared with the stock’s own sector, not the market.
- No impossible numbers (check the filing if a margin or growth looks absurd).
- I know why institutions or promoters changed their stake, if that was part of the screen.
- Risk decided: how much I can lose on this idea, and what would make me exit.
Glossary
| EPS | Earnings per share: profit ÷ number of shares. |
| TTM | Trailing twelve months: the last four reported quarters added up. |
| P/E | Price ÷ TTM EPS. |
| Book value | Shareholders’ equity on the balance sheet; per share, equity ÷ number of shares. |
| P/B | Price ÷ book value per share. |
| ROE | Return on equity: profit ÷ shareholders’ equity, in %. |
| ROCE | Return on capital employed: profit before interest and tax ÷ (equity + debt). |
| Debt / equity | Borrowings ÷ shareholders’ equity. |
| YoY | Year on year: compared with the same quarter a year earlier. |
| Net margin | Profit ÷ revenue, in %. |
| Promoter | Founder, family or parent company controlling the business. |
| FII / FPI | Foreign institutional / portfolio investors. |
| MF | Indian mutual funds. |
| Points | Change in a percentage: 10% to 11% is +1 point. |
| RS rating | 1–99 rank of 12-month price strength against all stocks. |
| Base effect | A huge growth % caused by a very small number a year earlier. |
| Value trap | A stock that looks cheap because its profits are about to fall. |
Questions
What is the best free stock screener for Indian stocks?
There are several. ChartMine’s screener is free, covers 1,448 NSE stocks and combines fundamentals (P/E, growth, margins, ROE, debt, P/B, promoter, FII and mutual fund holding) with price strength (RS rating, returns) on one page, with eleven ready-made screens.
How do I screen stocks with a low P/E and high growth?
Type a maximum P/E (for example 20) and a minimum profit growth (for example 20%) in the boxes, add a minimum market cap to remove very small companies, then compare each P/E with the stock’s own sector.
How often is the stock screener updated?
Prices update after every trading day. Fundamentals change as companies file quarterly results and shareholding patterns with NSE, mostly in the results seasons.
What does FII change mean in the screener?
How many percentage points of the company foreign investors added or sold between the last two quarterly shareholding filings. +0.50 means they own half a percent more of the company than a quarter earlier.
How do I find debt-free companies with a high ROE?
Press the Debt-free & profitable screen (debt/equity 0.1 or less and ROE 12% or more), or open More filters and type your own limits. Banks have no debt/equity figure, so they drop out of this screen.
What is a good P/B ratio for Indian stocks?
There is no single good number. P/B depends on the sector: banks and PSUs often trade near 1 to 2 times book, while brands and IT companies trade far higher. Compare a stock’s P/B and ROE with others in its own sector.
Is a stock that passes a screen a good buy?
Not by itself. In our study, most screens did roughly as well as the average stock over the next months. Use the list to choose what to research, and manage risk on anything you buy.