
☰ All tutorials
Start here
Tool tutorialsHow to trade with ChartMineStocks
Stock monitorMy watchlistStock scores & checklistMarket & sectors
Nifty 50Bank NiftySensexFin NiftyDaily market reportMarket breadthSector rotationSector heatmapStock screenerRelative strength (RS)MCX commodity pricesFear & Greed IndexWhat happens after…Scanners
Top gainers & losersStocks to watch tomorrowNR7 stocks scannerInside bar stocks52-week high stocksGap up & gap down stocksRSI oversold stocksGolden cross stocksSuperTrend buy stocksScan builderEMA 9/21 crossoverMACD crossoverADX strong trendBollinger breakout / squeezeVolume spike stocksOpen = high / open = lowCandlestick pattern scannerNarrow CPR scannerF&O data
F&O ban listOI build-upOption chainPCR & max painExpiry calendarF&O lot sizesOI build-up heatmapPCR trendMax pain trendFutures basisStock screens
Quarterly growersProfit growth stocksLow P/E stocksMutual fund buyingNear 52-week low, growingDebt-free companiesHigh ROE & ROCEMagic Formula stocksLow price-to-bookSmart money
FII / DII dataShareholding changesBig-money footprintShort selling dataF&O positions by participantBulk & block dealsPromoter buyingDelivery percentageCalendars
Results calendarQuarterly results trackerBoard meetingsCorporate actionsIPO calendarIPO performanceResearch & planning
Strategy testerCompare stocksDividend yield stocksASM / GSM listExpiry-day movesSeasonality & stock historyNSE holidays 2026Position size calculatorOption payoff calculatorPivot point calculatorMore
Stock scanners hubStock screensHow to use the quarterly results tracker
A plain-language guide to quarterly results: what each number means, how to read the season scoreboard and sector table, and what this season’s data says about growth and price reactions.
What the quarterly results tracker is, in plain words
Every listed company must publish its quarterly results: how much it sold (revenue), what it spent, and what was left over (profit) in the last three months. During results season more than a thousand NSE companies file within a few weeks. Reading each filing is impossible for one person.
The quarterly results tracker collects every filing as it arrives and turns it into a few numbers you can compare: revenue and profit growth against last year and last quarter, the profit margin, and how the share price reacted on the next session. It adds a scoreboard for the whole season and a sector breakdown.
On 9 Nov 2026 it covered the second quarter of FY27 (July to September 2026): 1,118 companies had reported, most recently on 7 Nov.
One line to remember: the tracker shows what each company reported and how the market reacted. Good numbers and a rising price are not the same thing: in this season the median company grew profit 21.3% and its share still fell 0.77% on the next session.
The numbers in a result, explained
A results filing has dozens of lines. The tracker keeps the ones most people need. Here is what each means, with a real example: Reliance Industries, Q2 FY27, filed on 30 Oct 2026.
| Number | What it means | Reliance, Q2 FY27 |
|---|---|---|
| Revenue | Total sales from the business in the quarter, in ₹ crore. | ₹3,32,861 crore |
| Revenue YoY | Growth against the same quarter last year (July–September 2025). Removes seasonal effects. | +28.6% |
| Revenue QoQ | Growth against the previous quarter (April–June 2026). Shows momentum but can be seasonal. | +6.7% |
| Profit | Net profit owed to the company’s own shareholders, after tax and after the share that belongs to minority owners of subsidiaries. | ₹25,548 crore |
| Profit YoY / QoQ | Profit growth on the same two bases. | +40.6% / +22.0% |
| Net margin | Profit as a share of revenue: how many rupees of profit from every ₹100 of sales. | 7.7% |
| Price reaction | Close-to-close change on the first session that ended after the filing. | +11.6% (2 Nov) |
Why YoY is the main yardstick
Many businesses are seasonal: air-conditioner makers sell most in summer, retailers around festivals. Comparing July–September with April–June mixes business performance with the weather and the calendar. Comparing with July–September of last year removes most of that, which is why analysts, and this tracker, lead with YoY.
When growth numbers look crazy
- Base effect. If last year’s profit was tiny, a normal profit now shows as hundreds of percent. Bandhan Bank’s Q2 FY27 profit of ₹622 crore was +455.8% YoY because the year-ago quarter was weak.
- Loss to profit or profit to loss. If either quarter is a loss, a growth percentage is meaningless. The tracker shows a dash when last year was a loss; a figure like Tata Chemicals’ −191% means the profit turned into a loss.
- One-off items. A sale of a business, a tax refund or a write-off can swing profit in one quarter. Always open the filing for anything that looks extreme.
Types of results filings and when they arrive
Not every results announcement is the same. Knowing the type helps you read it correctly.
| Type | What it is | What to watch |
|---|---|---|
| Standalone | The listed company on its own, without its subsidiaries. | Can look very different from the group, e.g. for holding companies. |
| Consolidated | The company plus its subsidiaries, as one group. | Usually the better picture of the whole business. |
| Quarterly (Q1–Q3) | Reviewed by the auditor (a “limited review”), not fully audited. | Due within 45 days of the quarter’s end. |
| Year-end (Q4) | Fourth quarter plus the audited full-year accounts, often with the final dividend. | Due within 60 days, so Q4 season runs into late May. |
Timing matters for the price
Companies choose when to file. Many large companies file after the 3:30 PM close (Reliance at 9:32 PM on 30 Oct 2026, HCL Technologies at 7:38 PM on 12 Oct 2026), so the reaction comes the next morning. Some file during market hours, so the price reacts while you watch. Banks often file on a Saturday (Axis Bank and HDFC Bank on 17 Oct 2026), which means two days of waiting before anyone can trade. The tracker’s “Filed” column shows the exact time, and the price reaction is always measured from the first session after it.
Results are approved at a board meeting announced in advance. You can see the coming meetings on the board meetings page and, for F&O stocks, the usual size of the reaction on the results calendar.
Why it matters: advantages and limits
✅ The whole season on one page
See every company that reported today, yesterday and last week, with growth and price reaction side by side.
✅ Context for one stock
A company growing profit 15% looks good until you see its sector grew 40%. The sector table gives that context.
✅ The market’s verdict
The price reaction column shows how the market judged the numbers, not just the numbers themselves.
✅ Ideas for research
Sort by profit growth or margin to find companies worth a closer look, then study them on their own pages.
What our test of this season shows
We took the 867 companies in the Q2 FY27 tracker (as of 9 Nov 2026) that had both a profit growth figure and a price reaction, and asked: did better growth mean a better reaction?
| Group | Companies | Median price reaction | Share that rose |
|---|---|---|---|
| Profit up YoY | 615 | −0.32% | 47% |
| Profit down YoY | 252 | −1.58% | 34% |
| Profit up more than 50% | 252 | −0.85% | 43% |
| Revenue and profit both up more than 20% | 305 | −0.75% | 45% |
| F&O stocks with profit up | 128 | +0.66% | 53% |
| F&O stocks with profit down | 44 | −0.29% | 48% |
- Falling profit was punished more often (only 34% rose) than rising profit (47%).
- But strong growth did not mean a rising price. Companies with profit up more than 50% rose only 43% of the time. Prices react to results versus expectations, and expectations are already in the price before the filing.
- The whole season leaned negative (median −0.77%), so part of every reaction was the general market mood of those weeks.
Limits. The data is collected automatically from NSE filings; a few arrive late or with errors. The reaction is one day only. Growth figures say nothing about valuation. Check the company’s own filing before acting.
A tour of the tracker screen
Open the quarterly results tracker. The page has four parts: the scoreboard, results by day, the sector breakdown and the full table.

- 1Companies that have filed results so far
- 2Share of companies whose profit grew year on year
- 3Median profit and revenue growth
- 4Median price reaction on the next session
The scoreboard is the season in four numbers. “Profit up YoY” counts only companies with a comparable year-ago quarter (942 of 1,118 on 9 Nov 2026), which is why the two counts differ.
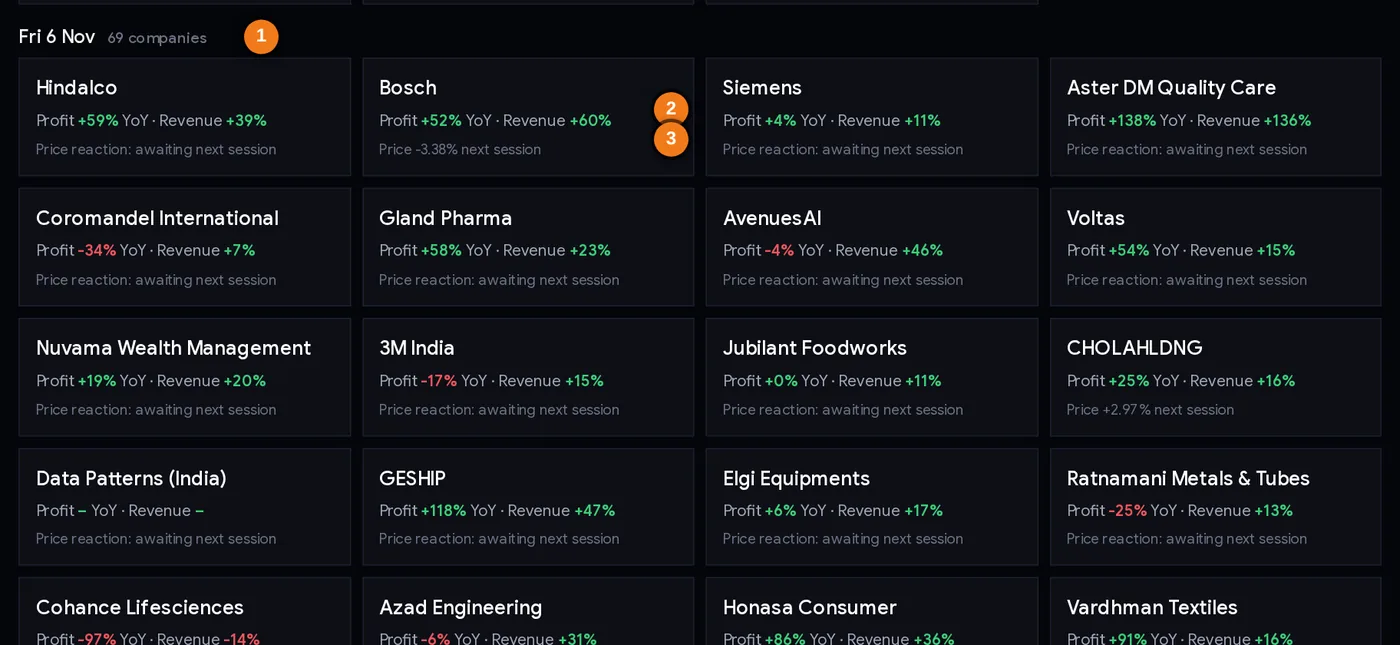
- 1Filing day and number of companies
- 2Profit and revenue growth against the same quarter last year
- 3Price reaction on the next session (or “awaiting”)
Results by day shows the latest filing days first, biggest companies first. Each card is one company: profit growth and revenue growth against last year, and the price reaction. “Awaiting next session” means the company filed after the last close; the reaction appears after the next trading day. Click a card to open the stock’s page.
By sector
Below the cards, bars show the median profit growth of each sector among companies that have reported. On 9 Nov 2026: textiles +81% (11 companies), oil & gas +45%, power +44%, metals +40%, IT +15%, FMCG +14%, realty +6%. The table next to it adds median revenue growth, the share with profit up, and the median price reaction (IT +1.07%, capital goods −1.63%, chemicals −2.34%). Small sectors with few reporters can swing a lot.
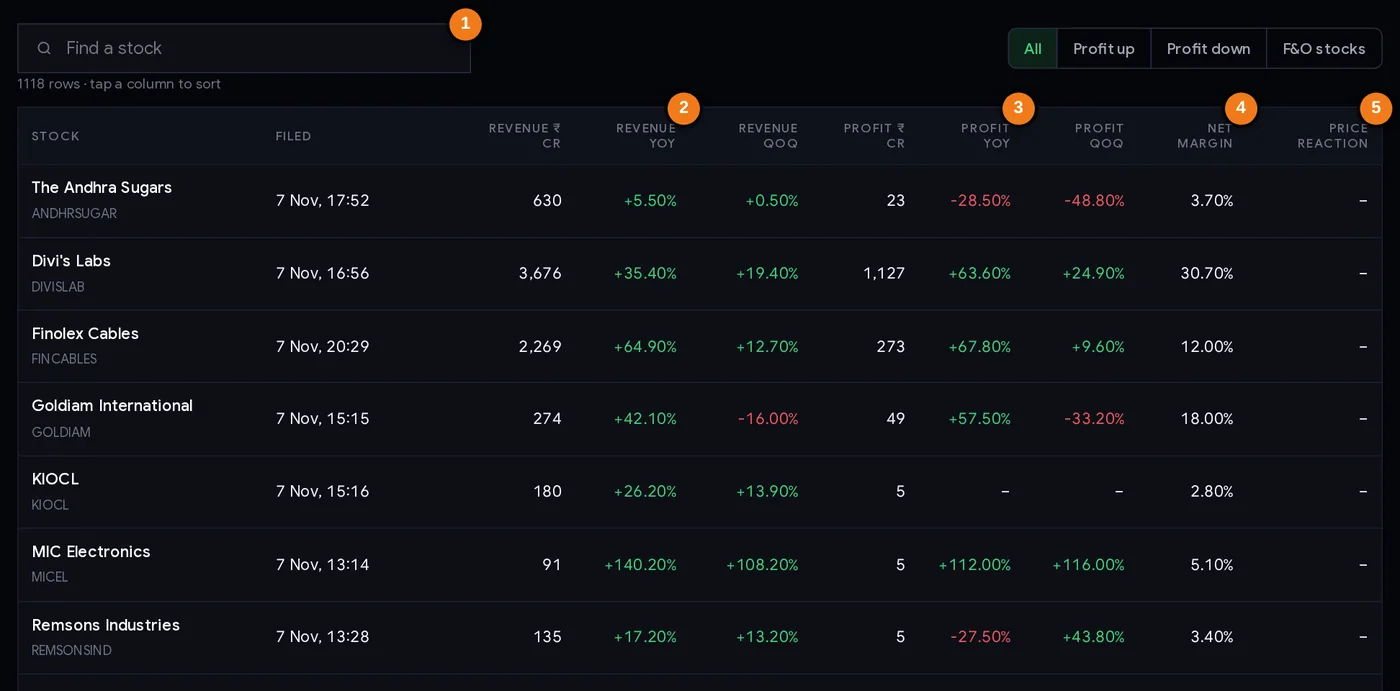
- 1Search and filter buttons (All, Profit up, Profit down, F&O stocks)
- 2Revenue growth, year on year
- 3Profit growth, year on year
- 4Net margin
- 5Price reaction
| Column | What it tells you |
|---|---|
| Stock / Filed | Company and the date and time of the filing. After 3:30 PM means the reaction is on the next session. |
| Revenue ₹ Cr, YoY, QoQ | Quarterly sales and their growth. |
| Profit ₹ Cr, YoY, QoQ | Net profit owed to shareholders and its growth. A dash means no meaningful comparison (a loss in the base quarter). |
| Net margin | Profit ÷ revenue. |
| Price reaction | Next-session close-to-close move. A dash means it is not known yet. |
The buttons above the table filter to Profit up, Profit down or F&O stocks; the search box finds one company; clicking a column header sorts by it.
Step by step: reading results season (15 minutes a day)
- Each evening, open the tracker and read the scoreboard. Is the share of companies growing profit rising or falling as the season goes on?
- Scan today’s cards for companies you own or follow.
- For each, compare YoY and QoQ. Growth against last year shows the trend; a sharp QoQ drop can be the first sign of a slowdown (Axis Bank: profit +37.6% YoY but −0.1% QoQ).
- Check the margin. Revenue up but margin down means costs grew faster than sales.
- Compare with the sector. A company growing 15% in a sector growing 40% is losing ground.
- Look for anything extreme (several hundred percent, a swing to loss) and open the filing to find the reason.
- Wait for the price reaction before drawing conclusions about how the market sees it, and look again three days later.
- Note upcoming results on the results calendar and board meetings page.
Three playbooks
Playbook A: the long-term investor’s quarterly check-up
Once a quarter, look up every company you own. Ask three questions: is revenue still growing YoY, is the margin stable or improving, and is profit growth in line with the sector? One bad quarter is not a reason to sell; two or three in a row deserve a closer look. Track it over time with the quarterly growers screen and the profit growth stocks list.
Playbook B: the “wait for the second day” trader
Our test showed strong growth often met with selling on day one. Some traders therefore wait: they note companies with strong numbers whose price fell or stayed flat on the reaction day, and watch whether the price stabilises over the following days. Any entry needs its own price signal and a stop loss below the reaction-day low. A falling price after good numbers can also mean the market knows something the headline does not.
Playbook C: sector temperature
Use the sector table to see which industries are reporting the strongest growth this season, then compare with price trends on the sector rotation page. Strong numbers in a sector the market is already buying are a different situation from strong numbers in a sector it is selling.
Risk first. Results are information, not instructions. Decide position size from your maximum loss using the position size calculator.
Case studies from Q2 FY27
All figures from the tracker on 9 Nov 2026; prices from NSE’s daily files.
1. Reliance Industries: big growth, big reaction
Filed on Friday 30 Oct 2026 at 9:32 PM. Revenue +28.6% YoY, profit +40.6% YoY and +22.0% QoQ. On Monday 2 Nov the share went from ₹1,164.90 to ₹1,300.00: +11.6%. When numbers are far better than expected in a company this large, the move can be unusually big.
2. HCL Technologies: steady growth rewarded
Filed on 12 Oct 2026 at 7:38 PM. Revenue +11.5%, profit +21.2% YoY. On 13 Oct the share rose from ₹1,223 to ₹1,326: +8.42%. In the same sector, TCS (profit +15.0%) rose 3.85% on 9 Oct.
3. Axis Bank: growth on paper, selling on the screen
Filed on Saturday 17 Oct 2026. Profit +37.6% YoY, which sounds excellent, but −0.1% QoQ. On Monday 19 Oct the share fell from ₹1,290 to ₹1,236: −4.19%. HDFC Bank (profit +5.6% YoY) fell 2.31% the same day. Lesson: a big YoY figure can hide a flat recent trend, and market expectations matter more than the headline.
4. Wipro and Maruti Suzuki: weak profit, rising price
Wipro’s profit was down 1.4% YoY (filed 15 Oct); the share rose 5.95% on 16 Oct. Maruti Suzuki’s profit fell 26.4% YoY while revenue grew 26.0% (filed 27 Oct); the share rose 1.13% on 28 Oct. Lesson: the market looks at many things beyond one quarter’s profit: orders, guidance, margins ahead, what was already priced in. Never assume falling profit means a falling share, or the reverse.
Common mistakes
- Buying because profit grew. In this season companies with profit up more than 50% rose on the next session only 43% of the time.
- Reading huge percentages literally. +455.8% (Bandhan Bank) was a base effect, not a business that grew five times.
- Ignoring QoQ. Axis Bank’s +37.6% YoY came with a flat QoQ profit.
- Comparing seasonal quarters QoQ only. Use YoY for seasonal businesses.
- Ignoring margins. Revenue growth with a falling margin can mean weaker pricing power.
- Judging on day one. Look again after three sessions.
- Trusting an automated number for an extreme case. Open the filing; a few arrive late or with errors.
Checklist for reading a result
- Revenue growth YoY, and is it faster or slower than last quarter?
- Profit growth YoY and QoQ: do they tell the same story?
- Net margin: stable, rising or falling?
- Any base effect, loss swing or one-off item behind an extreme number?
- How does the company compare with its sector’s median?
- What was the price reaction, and did it hold after three sessions?
- Have I checked the company’s own filing for anything unusual?
- Is any trade sized from my maximum loss, with a stop loss?
Glossary
| Revenue | Sales from the business in the quarter. |
| Net profit (to shareholders) | Profit after all costs and tax, owed to the company’s own shareholders. |
| YoY | Year on year: against the same quarter last year. |
| QoQ | Quarter on quarter: against the previous quarter. |
| Net margin | Profit ÷ revenue, in %. |
| Base effect | A growth rate inflated or deflated by an unusually low or high year-ago figure. |
| Price reaction | Close-to-close change on the first session after the filing. |
| Median | The middle value: half the companies are above it, half below. |
| Q2 FY27 | July to September 2026. |
| Consolidated results | Results of the company together with its subsidiaries. |
Questions
Which companies have announced Q2 FY27 results?
The quarterly results tracker lists every NSE company that has filed results for July to September 2026, latest first. On 9 Nov 2026 it had 1,118 companies; the list grows every evening as filings arrive.
How are Q2 FY27 results so far?
As of 9 Nov 2026, 70% of 942 companies with a comparable year-ago quarter grew net profit. The median company grew revenue 20.7% and profit 21.3% year on year, but the median next-session price reaction was −0.77%.
What is the difference between YoY and QoQ growth?
YoY compares with the same quarter last year and removes seasonal effects. QoQ compares with the previous quarter and shows recent momentum, but can be distorted by seasons. Read both together.
Why is profit growth sometimes several hundred percent?
Because growth is measured against the same quarter last year. If that profit was very small, even a normal profit gives a huge percentage. If last year was a loss, no growth figure is shown.
How is the price reaction measured?
As the close-to-close change on the first trading session that ended after the results were filed. Results filed after 3:30 PM or on a holiday count from the next session.
Are these results consolidated or standalone?
The tracker uses the profit owed to the company’s own shareholders from its filing. For groups with subsidiaries this is normally the consolidated figure. Check the filing itself for the exact basis.