
☰ All tutorials
Start here
Tool tutorialsHow to trade with ChartMineStocks
Stock monitorMy watchlistStock scores & checklistMarket & sectors
Nifty 50Bank NiftySensexFin NiftyDaily market reportMarket breadthSector rotationSector heatmapStock screenerRelative strength (RS)MCX commodity pricesFear & Greed IndexWhat happens after…Scanners
Top gainers & losersStocks to watch tomorrowNR7 stocks scannerInside bar stocks52-week high stocksGap up & gap down stocksRSI oversold stocksGolden cross stocksSuperTrend buy stocksScan builderEMA 9/21 crossoverMACD crossoverADX strong trendBollinger breakout / squeezeVolume spike stocksOpen = high / open = lowCandlestick pattern scannerNarrow CPR scannerF&O data
F&O ban listOI build-upOption chainPCR & max painExpiry calendarF&O lot sizesOI build-up heatmapPCR trendMax pain trendFutures basisStock screens
Quarterly growersProfit growth stocksLow P/E stocksMutual fund buyingNear 52-week low, growingDebt-free companiesHigh ROE & ROCEMagic Formula stocksLow price-to-bookSmart money
FII / DII dataShareholding changesBig-money footprintShort selling dataF&O positions by participantBulk & block dealsPromoter buyingDelivery percentageCalendars
Results calendarQuarterly results trackerBoard meetingsCorporate actionsIPO calendarIPO performanceResearch & planning
Strategy testerCompare stocksDividend yield stocksASM / GSM listExpiry-day movesSeasonality & stock historyNSE holidays 2026Position size calculatorOption payoff calculatorPivot point calculatorMore
Stock scanners hubStock screensHow to use the Market breadth page
A complete, plain-language guide to market breadth for Indian traders: what each measure means, how to read the charts, what our own 460-day test says about breadth as a signal, three playbooks and four real case studies from 2026.
What market breadth is, in plain words
NIFTY 50 is an average of 50 large companies, weighted by size. On most days it is a fair summary of the market. But it can hide a lot. A few giant banks can lift NIFTY while hundreds of smaller stocks fall. Market breadth answers a simpler question: how many stocks are actually taking part in the move?
Think of a cricket team. The scoreboard (NIFTY) says 300 runs. Breadth tells you whether eight batsmen scored or one batsman scored 250 and the rest got out cheaply. The first team is healthier, even though the score is the same.
The Market breadth page measures this every evening for the 1,421 most traded NSE stocks (every F&O stock plus every stock with a median turnover of ₹1 crore a day or more), using closing prices adjusted for splits and bonuses. It shows four things:
- Advances and declines: how many stocks closed up and down.
- % of stocks above their 50-day and 200-day averages: how many are in a short-term and a long-term uptrend.
- New 52-week highs minus new lows: how many are breaking out versus breaking down.
- The A/D line and McClellan oscillator: running measures of whether breadth is improving or fading.
One line to remember: breadth tells you how healthy a move is. It does not tell you the next direction, and on its own it is a poor timing tool.
The breadth measures, one by one
| Measure | How it is calculated | How to read it |
|---|---|---|
| Advances / declines | Stocks that closed higher vs lower than the previous close. Ratio = advances ÷ declines. | Ratio above 1: more stocks up. On 6 Nov 2026: 468 / 948, a ratio of 0.49. |
| % above 50-day average | Share of stocks whose close is above the average of their last 50 closes. | The short-term trend of the whole market. Swings fast, from under 10% to over 85%. |
| % above 200-day average | The same with a 200-day average. | The long-term trend. Readings under 20% have come near washed-out markets; above 80% near stretched ones. |
| New highs / lows | Stocks closing above their highest close (or below their lowest close) of the previous 250 sessions. | Many new lows = broad damage. Many new highs = broad strength. |
| A/D line | A running total: each day add advances minus declines. | Rising line = more up days than down days for the average stock. Compare its direction with NIFTY. |
| McClellan oscillator | A 19-day minus a 39-day exponential average of (advances − declines) ÷ (advances + declines) × 1,000. | Above zero: breadth improving. Below zero: fading. Very low readings (−80 or less) show heavy, broad selling. |
Divergence: the idea traders look for
A divergence is when the index and breadth disagree. Two kinds matter:
- Negative divergence: NIFTY makes a new high but fewer stocks are above their averages, or the A/D line falls. The rally is narrowing.
- Positive divergence: NIFTY makes a new low but fewer stocks make new lows than last time. Selling pressure is easing under the surface.
Divergences are warnings to be more careful or more alert. As the data below shows, they are not reliable signals by themselves.
Why breadth matters: advantages and limits
✅ Sees what the index hides
A 2% NIFTY day with two stocks falling for every one rising (6 Nov 2026) is very different from a broad rally.
✅ Tells you if stock-picking is easy
When 80% of stocks are above their 50-day average, most long ideas work. At 15%, even good stocks struggle.
✅ Spots washed-out markets
Extreme readings (very few stocks above averages, hundreds of new lows) have come near important lows.
✅ Objective
Counts, not opinions. Everyone looking at the same data sees the same numbers.
The limits (please read this part)
We tested the most popular reading: “buy when breadth is washed out, be careful when it is stretched”. Using our own history (460 trading days from 31 Dec 2024 to 6 Nov 2026), we grouped days by the % of stocks above their 50-day average and checked NIFTY 50 twenty sessions later.
| % above 50-day | Days | NIFTY 20 sessions later: average | Higher |
|---|---|---|---|
| Under 20% | 64 | +1.21% | 58% |
| 20% to 40% | 136 | +0.15% | 59% |
| 40% to 60% | 114 | −0.82% | 53% |
| 60% to 80% | 98 | +0.19% | 58% |
| 80% and above | 29 | −0.39% | 48% |
What this means in plain words:
- The pattern points the expected way, but weakly. Washed-out days were followed by slightly better NIFTY returns, stretched days by slightly worse ones.
- The differences are small and the sample is short. 58% versus 53% over less than two years is not something to bet on with size.
- Divergence days were mixed. We found 8 days when NIFTY moved 1% or more while more stocks went the other way. Five sessions later NIFTY was lower after 6 of the 7 days we could measure, but twenty sessions later the results were split.
- Overlapping days count the same episode many times (a washed-out week contributes five days), so the real number of independent cases is much smaller.
So how should you use it? As a context gauge: how aggressive or careful to be, and whether the index is telling the whole story. Combine it with price on the index chart, and always with a stop loss.
A tour of the Market breadth page
Open Market breadth. The page has a row of four headline boxes and three charts.

- 1Advances / declines and their ratio
- 2% of stocks above their 50-day average, and the change in a week
- 3% above their 200-day average, and how unusual that is
- 4New 52-week highs and lows
| Box | What it tells you (6 Nov 2026) |
|---|---|
| Advances / declines | 468 rose, 948 fell, ratio 0.49. Green when advances win, red when declines win. |
| Above 50-day average | 35%, and the change over a week: +18 points. Short-term breadth was recovering fast from a low. |
| Above 200-day average | 47%, “higher than 50% of days” in our history: a middle reading. |
| New highs / lows | 34 new 52-week closing highs against 18 new lows. |
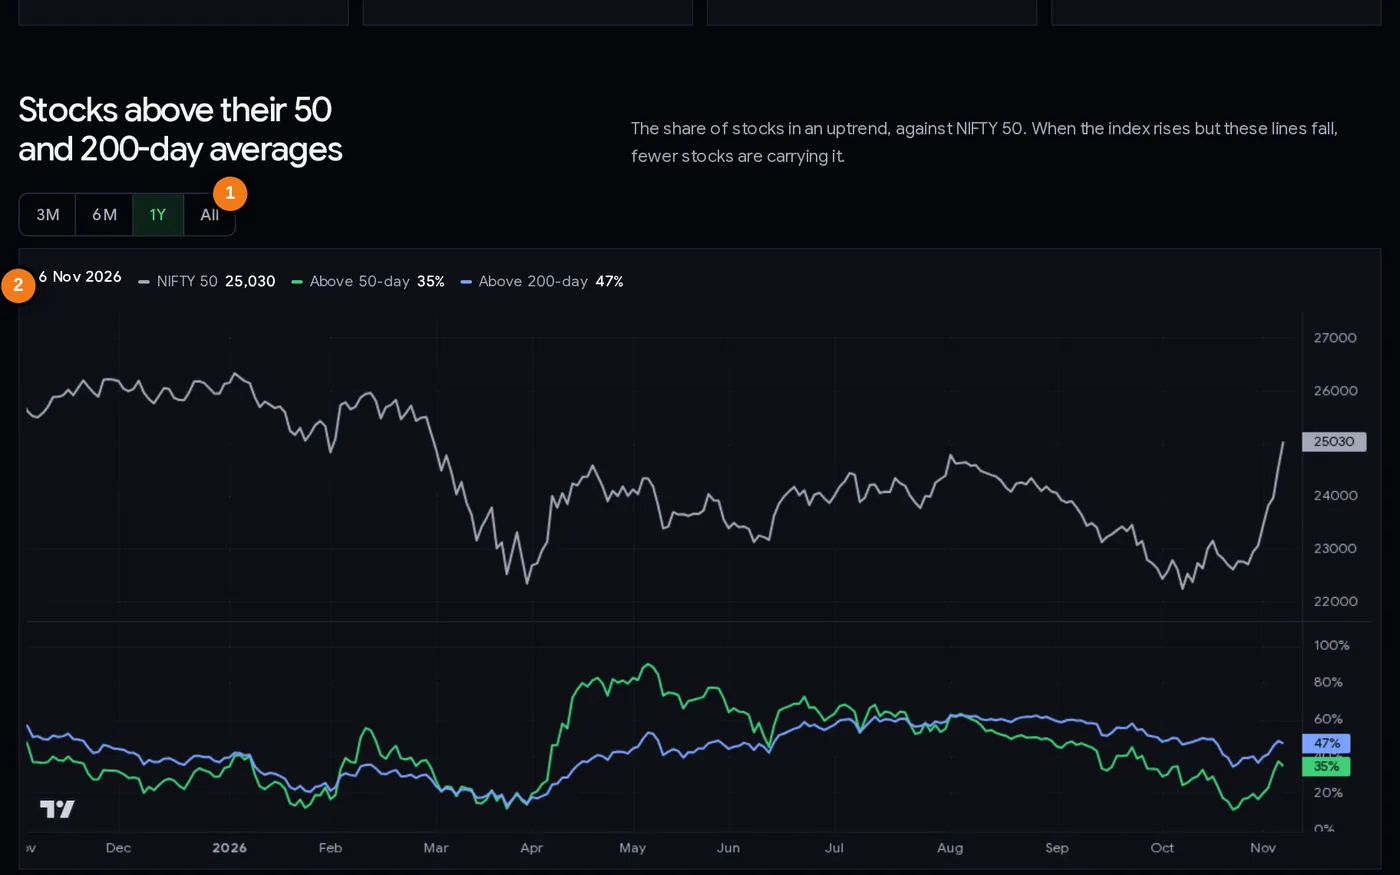
- 1Range buttons: 3 months to all history
- 2Legend: NIFTY 50, above 50-day, above 200-day
The first chart puts NIFTY 50 (grey) on top and the % of stocks above their 50-day (green) and 200-day (blue) averages below. Use the 3M / 6M / 1Y / All buttons to change the range. Hover or tap the chart to read any day’s values. What to look for: does the green line rise and fall with NIFTY, or drift the other way?
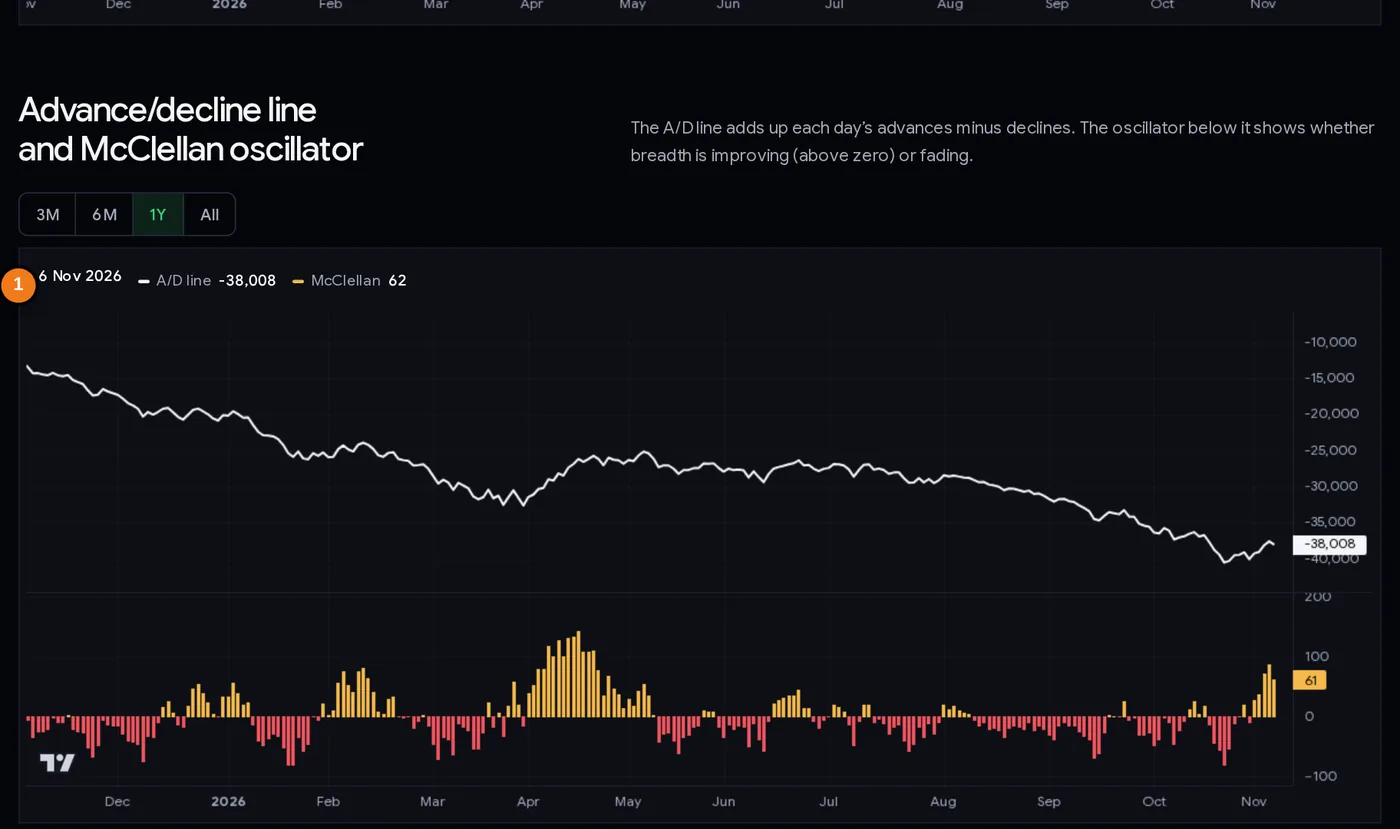
- 1A/D line (running total) and McClellan oscillator (bars, above or below zero)
The second chart shows the A/D line (white) and the McClellan oscillator (orange bars). Look at the picture: over the year to 6 Nov 2026 the A/D line fell from about −14,000 to −38,008, while NIFTY 50 ended the year only about 3% lower. The average stock had many more down days than up days, a much worse year than the index suggests. The oscillator bars also show the sell-off of October (deep red) and the turn in early November (tall yellow bars; 62 on 6 Nov).
The third chart (not shown) is a bar for each day: new 52-week highs minus new lows. Bars above zero mean more stocks broke out than broke down.
Step by step: reading breadth in five minutes
- Open the page in the evening. It is rebuilt after NSE’s end-of-day files arrive (the site refreshes at about 8 PM and again around 10:15 PM IST). Check the date under the advances/declines box.
- Compare today’s advances and declines with NIFTY’s move. Same direction = broad move. Opposite = narrow move led by a few large stocks.
- Read the % above 50-day. Under 20%: washed out, most stocks in short-term downtrends. 40–60%: neutral. Over 80%: stretched, most stocks already extended.
- Read the % above 200-day and its percentile. This tells you the long-term regime. Is the market broadly in an uptrend or not?
- Look at the McClellan oscillator. Has it just crossed above zero after a deep negative reading? That shows breadth turning up.
- Check new highs minus new lows. A cluster of large negative bars shows broad breakdowns; the first positive bars after that are worth noting.
- Write one sentence in your journal: “Breadth is washed out / neutral / stretched, and improving / fading.” Use it to set how big your positions are and how quickly you take profits.
Three ways traders use breadth
Playbook A: position sizing by regime
Many swing traders scale their exposure with breadth. For example: when more than 60% of stocks are above their 50-day average and the McClellan oscillator is positive, they take normal-size trades. Between 30% and 60%, half size. Below 30%, only very small trades or none, until the oscillator turns up. The exact numbers are a personal choice; the idea is to risk less when the average stock is falling.
Playbook B: confirm an index breakout
When NIFTY breaks above a resistance level, check breadth that day. A breakout with advances well ahead of declines and a rising A/D line is broad. A breakout on a day like 6 Nov 2026 (NIFTY +2.01%, 468 up and 948 down) is narrow: traders who trade it often use a tighter stop or a smaller size.
Playbook C: wait for the turn after a washout
When breadth is extremely weak (under 15% above the 50-day average, new lows in the hundreds, McClellan below −50), some traders stop selling and start building a watchlist. They do not buy the first day; they wait for evidence of a turn: a McClellan oscillator back above zero, a day with three or four times as many advances as declines, and NIFTY reclaiming a recent swing high. Case 1 below is an example; case 2 shows that the wait can be long.
Breadth never replaces a stop loss. Decide your risk per trade first and use the position size calculator.
Case studies from real data
Four episodes from our breadth history (NSE closing prices, 1,421 stocks). NIFTY values are closing levels. The charts are recalculated every evening over today’s list of stocks, so an old day’s counts can differ by a few stocks from that day’s market report; we quote the report for advances and declines.
1. October 2026: the washout and the rebound
On 23 Oct 2026 only 11% of stocks were above their 50-day average, there were 251 new 52-week lows against 5 new highs, and the McClellan oscillator fell to −81.6, its lowest reading in this stretch. That day’s report counted 149 advances against 1,273 declines. NIFTY closed at 22,600.
The turn did not come in one day. On 27 Oct advances beat declines 1,094 to 328. On 2 Nov they beat them 1,115 to 311 and the oscillator was back above zero (+25.6), where it stayed for the rest of the week. By 6 Nov NIFTY was at 25,030, about 10.8% above the 23 Oct close, and the % above the 50-day average had recovered to 35%. Lesson: extreme breadth readings can mark a low, and the confirmation (oscillator back above zero, broad up days) came while there was still room to move.
2. March 2026: washed out for weeks
On 23 Mar 2026 only 13.2% of stocks were above their 200-day average, the lowest reading in our history (which starts in August 2025 for this measure). NIFTY was at 22,513. Five sessions later it was only 0.7% higher, and the 200-day reading stayed under 20% into April. Twenty sessions later NIFTY was at 23,898 (+6.2%). Lesson: a washed-out market can stay washed out for weeks. Breadth helps you know where you are, not when it turns.
3. 7 May 2026: stretched, then a pullback
On 7 May 2026, 90.3% of stocks were above their 50-day average, the highest reading in our data. NIFTY was at 24,327. Twenty sessions later (5 Jun) it was at 23,367, about 4% lower. A year earlier, on 19 May 2025, the reading was 88.5% with NIFTY at 24,945; twenty sessions later NIFTY was at 24,947, unchanged, not crashed. Lesson: very strong breadth means much of the easy gain in the average stock may already be in. It is a reason to tighten stops, not a sell signal.
4. Narrow up days: 15 Oct and 6 Nov 2026
On 15 Oct 2026 NIFTY rose 1.66% while 390 stocks rose and 1,016 fell. Five sessions later NIFTY was 1.7% lower, and the washout of case 1 followed. On 6 Nov 2026 NIFTY rose 2.01% with 468 up and 948 down. What follows that day was not known when this guide was written. Lesson: a narrow up day is a yellow flag, worth a tighter stop. Earlier examples in our data (16 Mar and 17 Jul 2026) were also followed by lower prices five sessions later, yet twenty sessions later NIFTY was higher in both cases.
Common mistakes
- Using breadth as a timing signal. Case 2: under 20% above the 200-day average for weeks before the market turned.
- Selling everything when breadth is stretched. Case 3: a 90% reading came before a 4% dip in 2026, while a similar reading in 2025 was followed by a flat month, not a fall.
- Reading one day in isolation. Breadth is noisy day to day; watch the 50-day line and the oscillator over weeks.
- Forgetting what is counted. These are 1,421 actively traded stocks, equally counted. A ₹500 crore company counts as much as Reliance.
- Ignoring the regime. The 200-day reading was below 63% throughout our history from August 2025. “Normal” depends on the period.
- Mixing up the A/D line’s level with its direction. The level depends on the start date. Only its direction matters.
Breadth checklist
- The page date is the latest trading day.
- Advances vs declines compared with NIFTY’s move: broad or narrow?
- % above 50-day: washed out (under 20%), neutral, or stretched (over 80%)?
- % above 200-day and its percentile: long-term regime noted.
- McClellan oscillator above or below zero; any recent cross?
- New highs minus new lows: positive or negative, and the trend over two weeks.
- Position size adjusted to the regime; stop losses unchanged in principle.
- No trade taken because of breadth alone.
Glossary
| Breadth | How many stocks participate in a market move. |
| Advance / decline | A stock that closed higher / lower than the previous day. |
| A/D ratio | Advances divided by declines. |
| A/D line | Running total of advances minus declines. |
| Moving average (50-day, 200-day) | The average of the last 50 or 200 closing prices; a stock above it is in an uptrend on that time frame. |
| 52-week high / low | A close above the highest (below the lowest) close of the previous 250 sessions. |
| McClellan oscillator | 19-day minus 39-day exponential average of net advances (ratio-adjusted). |
| Divergence | The index and breadth moving in different directions. |
| Washed out | Very few stocks in uptrends after heavy selling. |
| Stretched | Almost all stocks above their averages after a strong run. |
Questions
What is market breadth in the stock market?
Market breadth measures how many stocks take part in a move: advances vs declines, the share of stocks above their 50 and 200-day averages, and new highs vs new lows. If NIFTY rises while most stocks fall, breadth is weak.
What is a good advance decline ratio?
Above 1 means more stocks rose than fell. Ratios of 2 or more show a broad up day, under 0.5 a broad down day. On 6 Nov 2026 the ratio was 0.49 even though NIFTY rose 2.01%.
How many NSE stocks are above their 200-day moving average?
ChartMine shows it every evening on the Market breadth page for the 1,421 most traded NSE stocks. On 6 Nov 2026 it was 47%. The lowest reading in our history was 13.2% on 23 Mar 2026.
What does the McClellan oscillator tell you?
Whether breadth is improving (above zero) or fading (below zero). It is the 19-day minus the 39-day exponential average of net advancing stocks. On 23 Oct 2026 it fell to −81.6 during a broad sell-off and was back above zero from 2 Nov.
Is market breadth a good timing indicator?
Not on its own. In our test over 460 trading days, washed-out readings were followed by slightly better NIFTY returns, but the difference was small and washed-out markets sometimes stayed that way for weeks. Use breadth for context and position sizing.
Why did NIFTY rise when most stocks fell?
NIFTY is weighted by company size, so a few large stocks can lift it. Breadth counts every stock equally, so it shows when a rally is narrow.
When is the market breadth page updated?
Every trading day in the evening, after NSE publishes its end-of-day files.