
☰ All tutorials
Start here
Tool tutorialsHow to trade with ChartMineStocks
Stock monitorMy watchlistStock scores & checklistMarket & sectors
Nifty 50Bank NiftySensexFin NiftyDaily market reportMarket breadthSector rotationSector heatmapStock screenerRelative strength (RS)MCX commodity pricesFear & Greed IndexWhat happens after…Scanners
Top gainers & losersStocks to watch tomorrowNR7 stocks scannerInside bar stocks52-week high stocksGap up & gap down stocksRSI oversold stocksGolden cross stocksSuperTrend buy stocksScan builderEMA 9/21 crossoverMACD crossoverADX strong trendBollinger breakout / squeezeVolume spike stocksOpen = high / open = lowCandlestick pattern scannerNarrow CPR scannerF&O data
F&O ban listOI build-upOption chainPCR & max painExpiry calendarF&O lot sizesOI build-up heatmapPCR trendMax pain trendFutures basisStock screens
Quarterly growersProfit growth stocksLow P/E stocksMutual fund buyingNear 52-week low, growingDebt-free companiesHigh ROE & ROCEMagic Formula stocksLow price-to-bookSmart money
FII / DII dataShareholding changesBig-money footprintShort selling dataF&O positions by participantBulk & block dealsPromoter buyingDelivery percentageCalendars
Results calendarQuarterly results trackerBoard meetingsCorporate actionsIPO calendarIPO performanceResearch & planning
Strategy testerCompare stocksDividend yield stocksASM / GSM listExpiry-day movesSeasonality & stock historyNSE holidays 2026Position size calculatorOption payoff calculatorPivot point calculatorMore
Stock scanners hubStock screensHow to use ChartMine stock scores
A plain-language guide to ChartMine’s three stock scores and the 18-point checklist: what a relative score is, how each pillar is built, how to read every screen, worked examples with real numbers, playbooks, limits and common mistakes.
What the stock scores are, in plain words
Reading a company’s profits, debt, cash flow and price history takes an evening per stock. The Stock scores page squeezes those numbers into three scores from 0 to 100 for about 1,300 NSE stocks, plus an 18-point yes/no checklist for each one.
- Quality: how good the business looks on paper. Does it earn a lot on its capital? Is debt under control? Has profit grown steadily? Does it generate cash?
- Valuation: how much you pay for that business compared with similar companies and with its own past. Cheaper scores higher.
- Momentum: how the share price has been behaving. Is it above its moving averages, near its 52-week high, beating NIFTY 50?
You will find the scores in three places:
- The score card on every stock page, right below the price chart (for example HDFC Bank). It shows the three scores, the stock’s rank inside its sector and how many checklist points it passes.
- The full score page for each stock at /stock/<name>/score/ (for example Reliance). It shows how every score is built, the full checklist, and a comparison with the sector.
- The index at /stock-scores/: the 20 highest-ranked stocks on each score, then every scored stock grouped by sector, with a search box.
One line to remember: a score is a rank, not a grade and not a prediction. A quality score of 80 means the company’s numbers beat about 80% of other NSE stocks on those measures today. It says nothing about where the share price will go next.
What a relative score means (the most important idea)
School marks are absolute: 80 means 80 right answers, however the class did. ChartMine’s scores are relative: they show where a stock stands in the queue of all scored stocks.
How one number becomes a percentile
Take return on equity (ROE). ChartMine lines up the ROE of every scored stock from lowest to highest. A stock’s percentile is the share of the others it beats. A percentile of 30 means it beats 30% and 70% beat it. When several stocks have exactly the same value they share the average position, so ties are fair.
How percentiles become a score
Each score is simply the average of the percentiles of its parts. Reliance on 9 Nov 2026 is a good example of quality:
| Quality part | Reliance | Percentile |
|---|---|---|
| ROE | 9.0% | 30 |
| ROCE | 12.2% | 35 |
| Debt / equity (lower is better) | 0.41 | 31 |
| Interest cover | 5.2× | 37 |
| Profit growth consistency | 6 of 8 quarters | 65 |
| Free cash flow margin (FY26) | 6.4% | 65 |
(30 + 35 + 31 + 37 + 65 + 65) ÷ 6 = 43.8, shown as 44 (Average). The percentiles on the page are rounded, so if you add them up yourself you can be one point off the score; the score is worked out from the unrounded values.
Notice what this means. Reliance’s debt/equity of 0.41 passes the checklist’s “debt below half of equity” test, yet its percentile is only 31, because about two-thirds of scored stocks carry even less debt. Relative and absolute views can disagree, and both are useful.
The three labels
| Score | Quality | Valuation | Momentum |
|---|---|---|---|
| 67 to 100 | Strong | Inexpensive | Strong |
| 34 to 66 | Average | Fair | Neutral |
| 0 to 33 | Weak | Expensive | Weak |
Because a score is an average of several ranks, it is pulled towards the middle. Very few stocks are at the top on every part. On 9 Nov 2026, 290 stocks had a Strong quality score and 288 a Weak one, out of 1,240 with a quality score: fewer than a third in each band. Only 19 stocks scored 67 or more on all three pillars at once.
How each score is built
Every part is ranked against all other scored stocks (1,324 on 9 Nov 2026); for momentum, higher always ranks higher. A score needs at least 2 parts for quality, 2 for valuation and 3 for momentum, and the card says how many were used (“From 6 of 6 components”).
Quality: is this a good business?
| Part | What it measures | Better = |
|---|---|---|
| ROE (return on equity) | Profit of the last four quarters ÷ average shareholders’ money. | Higher |
| ROCE (return on capital employed) | Pre-tax profit + interest ÷ equity + borrowings: profit on all the money in the business. | Higher |
| Debt / equity | Borrowings ÷ equity. Lease liabilities are not in NSE filings, so they are not counted. | Lower |
| Interest cover | Pre-tax profit + interest ÷ interest, last four quarters. A debt-free company with no interest cost and a profit counts as unlimited cover. | Higher |
| Profit growth consistency | Of the last 8 quarters, how many had higher profit than the same quarter a year earlier. Needs at least 6 comparable quarters. | Higher |
| Free cash flow margin | Operating cash flow minus capital spending, as a % of the year’s sales (latest full year). | Higher |
Banks, NBFCs and insurers use only ROE and profit consistency: for a lender, borrowing is the raw material, so debt, interest cover, ROCE and free cash flow do not fit. HDFC Bank’s card says “From 2 of 2 components”.
Valuation: what are you paying?
| Part | What it measures | Better (scores higher) = |
|---|---|---|
| P/E ÷ sector median | Price ÷ earnings per share of the last four quarters, against the median P/E of the stock’s sector (sectors with at least 4 stocks, P/E between 0 and 300). | Lower |
| P/E ÷ own 5-year median | Today’s P/E against the median P/E at the last five fiscal year ends. Only for F&O stocks, because ChartMine keeps five years of adjusted prices for those. | Lower |
| P/B ÷ sector median | Price ÷ book value per share, against the sector median. | Lower |
| Free cash flow yield | Free cash flow ÷ market value. Not used for financial companies. | Higher |
If the company made a loss over the last four quarters, P/E has no meaning and the valuation score is n/a. ChartMine does not fall back to book value alone, because that would mislead.
Momentum: how is the price behaving?
- RS rating (1–99): 12-month return with the latest quarter counted twice, ranked against all tracked NSE stocks (see relative strength stocks).
- vs 200-day and 50-day averages: how far the price is above (+) or below (−) its long- and medium-term average.
- Place in 52-week range: 0% = at the 52-week low, 100% = at the high.
- 6-month strength vs NIFTY 50: six-month return minus NIFTY 50’s, in points.
Why use scores: advantages and limits
✅ A first look in seconds
Three numbers place a stock’s business, price tag and trend against the whole market.
✅ Fair comparison
Valuation is judged against the stock’s own sector and history, not against unrelated industries.
✅ Open working
Every score page shows each raw number and its percentile. You can check every step.
✅ A homework list
The 18-point checklist turns a vague “is this a good stock?” into specific questions you can research one by one.
The limits (please read this part)
- Relative, not absolute. In a bad year the best of a bad lot still scores high.
- Scores change every trading day. Prices move every day, so valuation and momentum ranks move too. Quality changes mostly when new quarterly results or balance sheets arrive.
- Not a forecast, and not tested as one. ChartMine only started saving daily score history on 10 Nov 2026 (the first saved day uses prices of 9 Nov). There is no past record to test, so we cannot tell you whether high-scoring stocks went on to do better. We will not pretend otherwise. Any claim that these scores “work” would need years of history.
- Data gaps. On 9 Nov 2026, 128 of 1,452 tracked stocks had no score (no quarterly results, fewer than four quarters, or too few parts). Of the 1,324 scored, 84 had no quality and 91 no valuation score. Of those 91, 75 made a loss over the last four quarters; the other 16 had only one of the four valuation parts, 13 of them among the 14 stocks whose sector is not classified (no sector median to compare with).
- Financial companies use fewer parts. A bank’s quality score rests on just two numbers, so one change moves it a lot. On 9 Nov 2026 only 66 of the 148 scored Financial Services stocks had a quality score.
- Own-history P/E is for F&O stocks only. Smaller stocks are judged against their sector and on cash flow, not against their own past.
- Filings can be late or wrong, and a bad figure moves a score until it is corrected.
A tour of the screens
1. The score page of one stock
Open any stock’s score page, for example Reliance. The top shows the three score cards and a one-line summary.
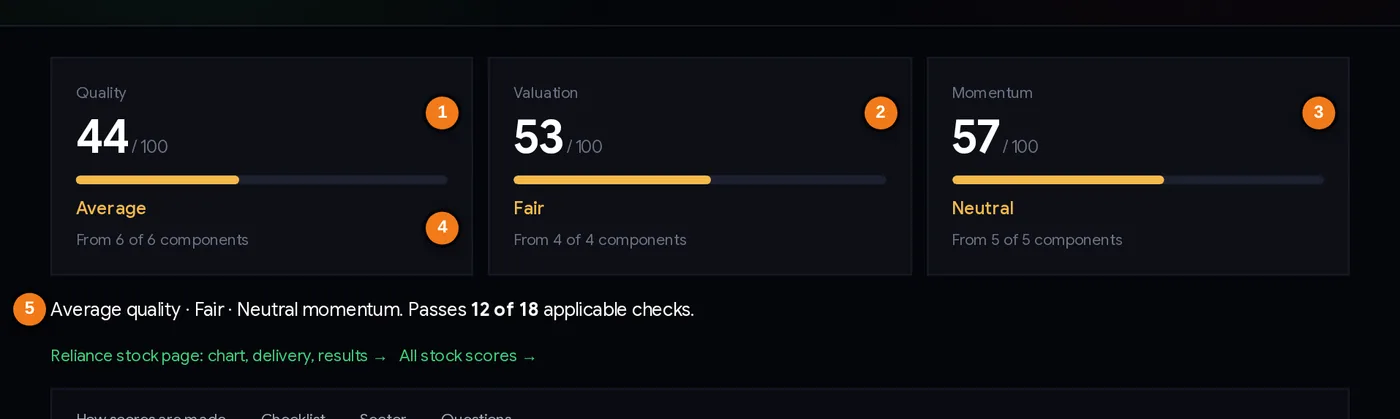
- 1Quality score with its bar and label.
- 2Valuation score (cheaper scores higher).
- 3Momentum score.
- 4How many of the possible parts the score is built from.
- 5One-line summary and checklist passes out of applicable checks.
Each card shows the score, a bar (green 67+, amber 34–66, red 33 or less), the label and the parts used. Below are four sections: How scores are made (raw value and percentile of every part), Checklist, Sector (scores vs the sector median, and the sector’s top 5 by quality) and Questions.
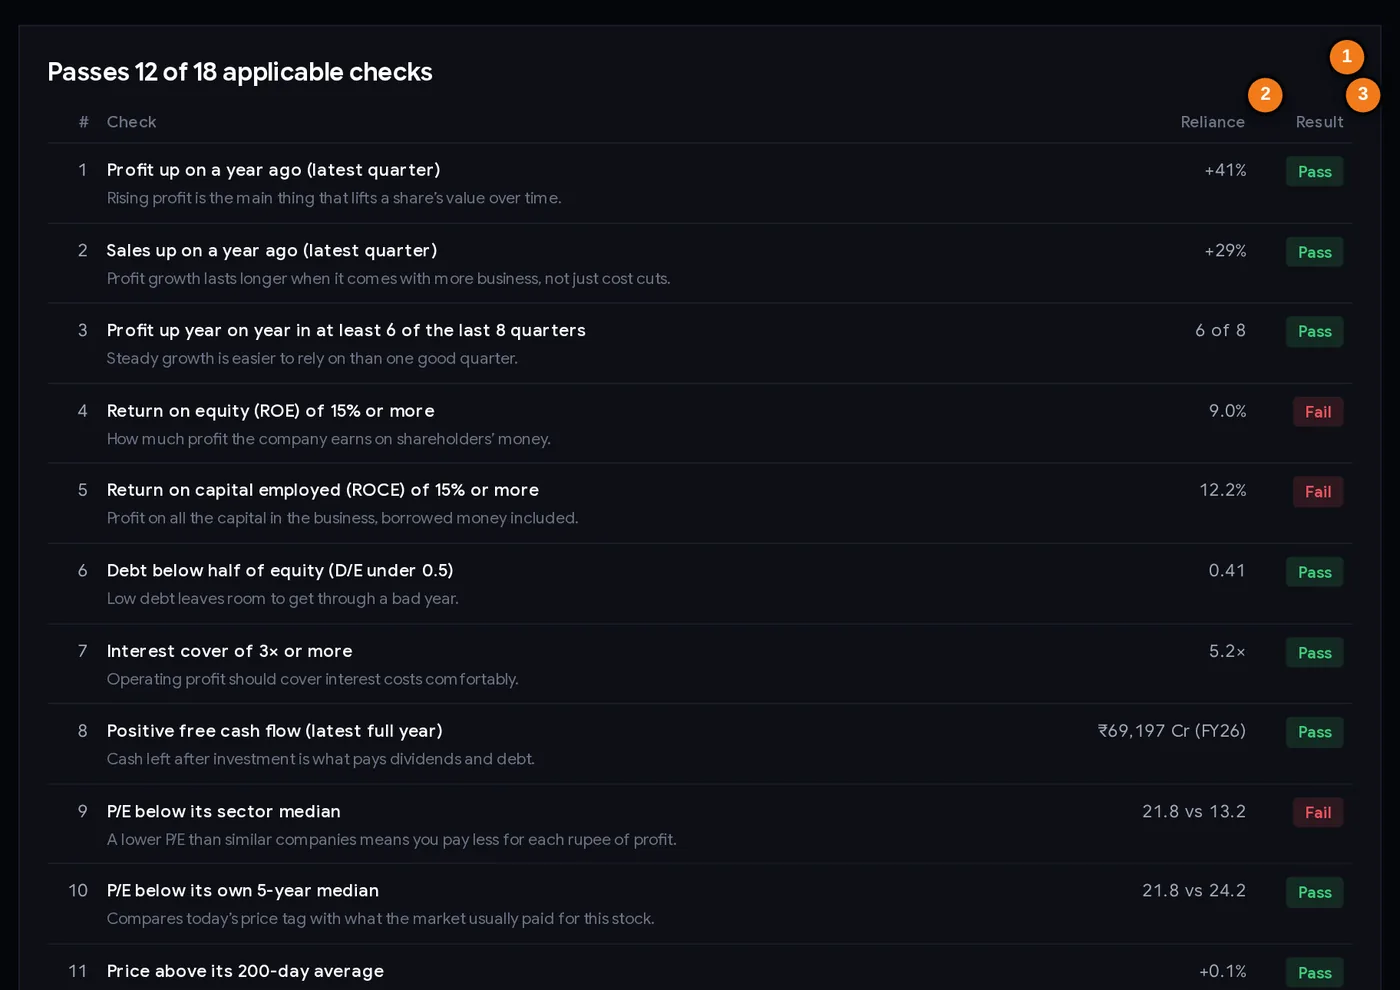
- 1Checks passed out of those that apply (n/a checks are left out).
- 2The stock’s own value for each check.
- 3Pass, Fail or n/a.
The checklist shows the check, the stock’s own value, and a Pass, Fail or n/a badge. The header counts only checks that apply: Reliance passes 12 of 18; HDFC Bank passes 10 of 13 because 5 checks are n/a for it.
2. The score card on the stock page
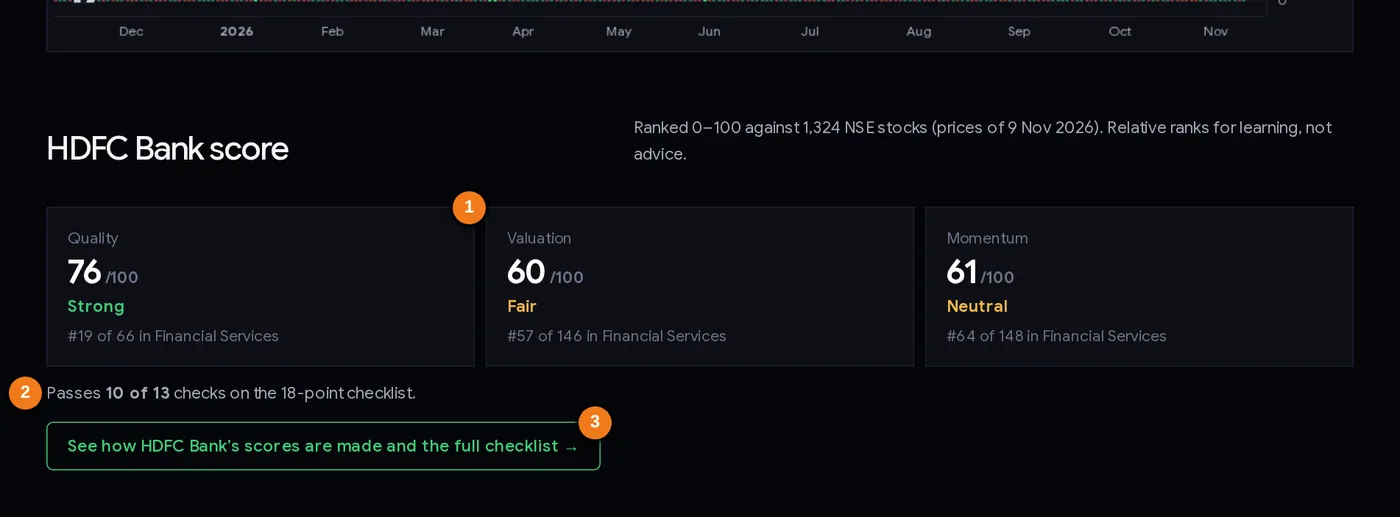
- 1Each pillar’s score, label and rank inside the sector (stocks with n/a are left out of the rank).
- 2Checklist passes out of applicable checks.
- 3Opens the full score page.
On every stock page the same three scores appear right after the price chart, with one extra line: the sector rank. HDFC Bank’s card on 9 Nov 2026 read “#19 of 66” for quality, “#57 of 146” for valuation and “#64 of 148” for momentum, all in Financial Services. The “of” number can differ by pillar because stocks with n/a are left out of that ranking. The button below the card opens the full score page. Further down, the Company details card lists the sector, industry and macro sector as the exchanges classify the company (for example Reliance: Oil & gas, Refineries & Marketing, Energy), which tells you which sector it is compared with, plus its ISIN, NSE symbol, BSE code, listing date and face value.
3. The Stock scores index
The Stock scores page has two parts. At the top, Highest scores lists the 20 highest-ranked stocks, with four tabs: Quality, Valuation, Momentum and Checks passed (the last one only counts stocks with at least 10 applicable checks). Below it, Every stock, by sector holds all 1,324 scored stocks in 23 sections that open and close.
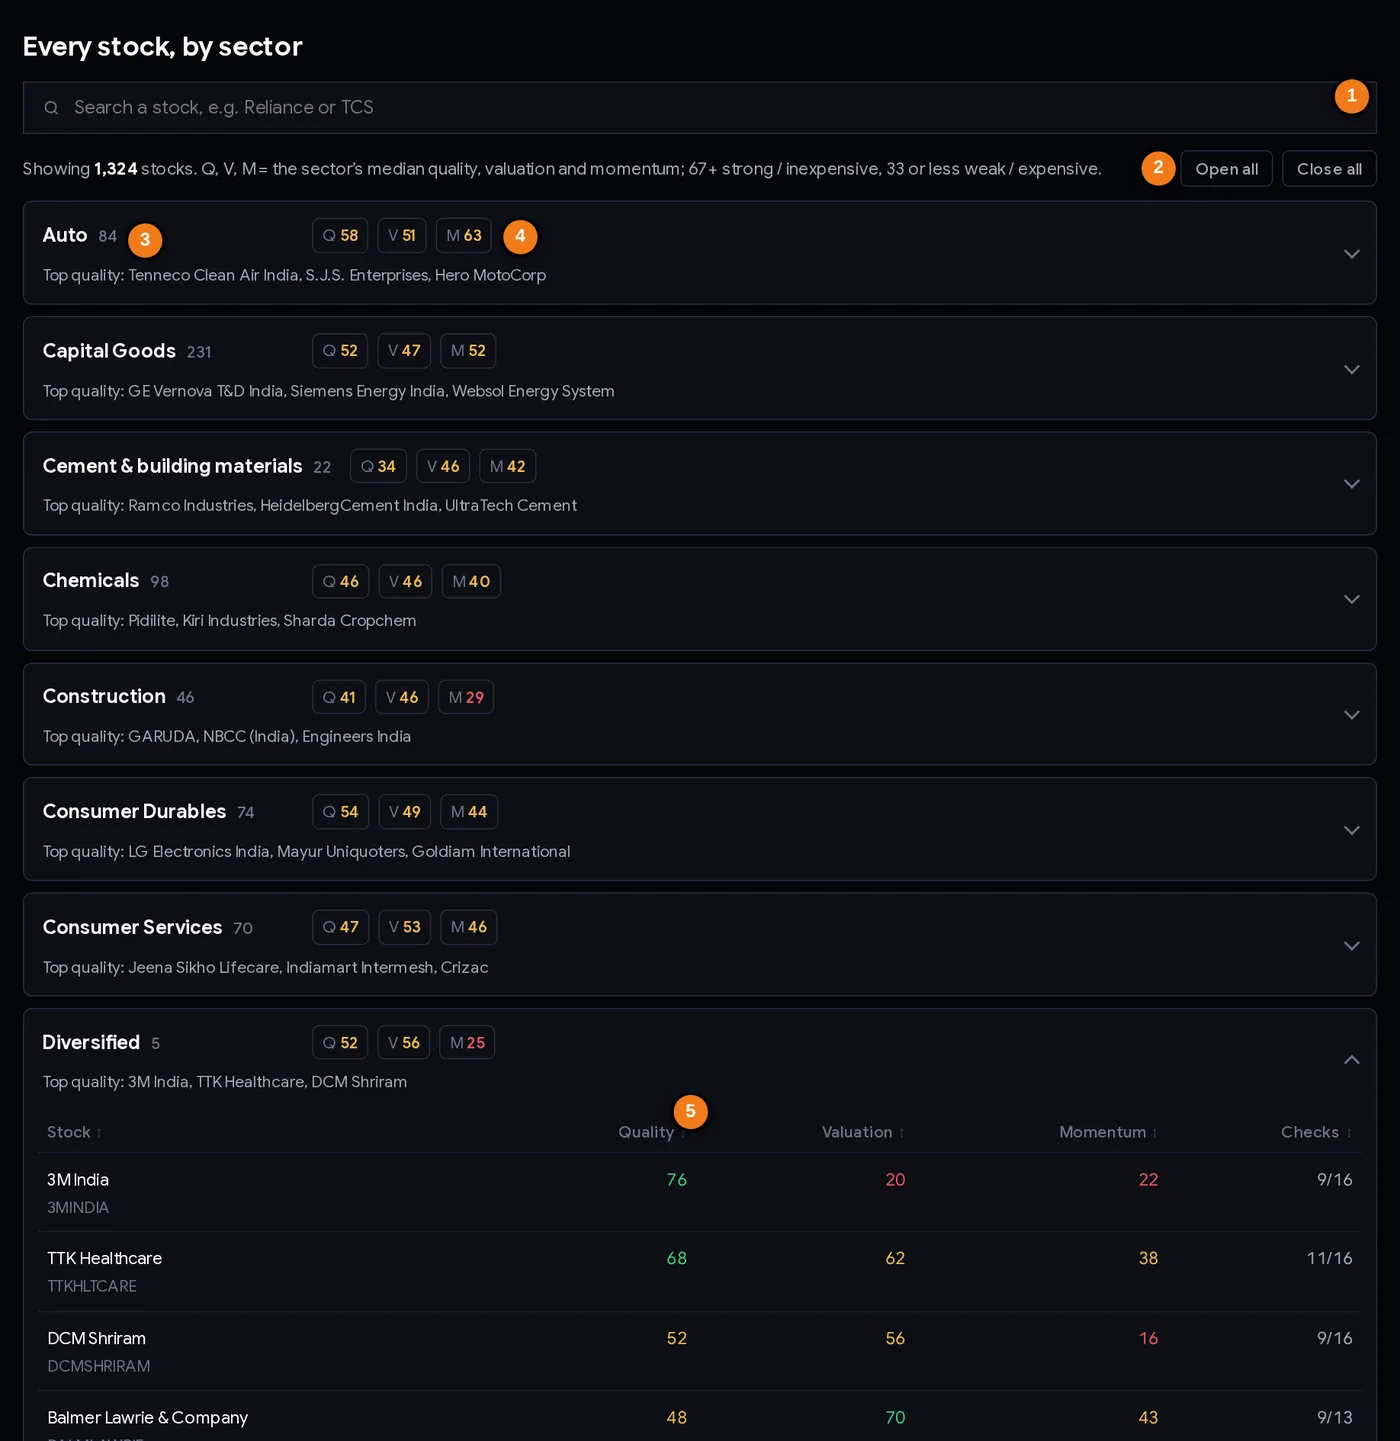
- 1Search a stock by name or NSE symbol.
- 2Open all / Close all sections.
- 3Number of scored stocks in the sector.
- 4The sector’s median Quality, Valuation and Momentum.
- 5An opened sector: tap a column header to sort.
| Part of the screen | What it does |
|---|---|
| Highest scores tabs | Switch the top-20 list between quality, valuation, momentum and checks passed. Each row shows the stock, its sector and all four numbers. |
| Search box | Type part of a company name or NSE symbol (for example “hdfc” or “KRBL”). Matching stocks show in every sector, the sectors that contain them open, and the “Showing N stocks” count updates. Clear the box to close them again. |
| Open all / Close all | Open or close every sector section at once. |
| Sector sections | 22 sectors plus “Sector not classified”. Each closed section shows the sector name, its number of scored stocks, the sector’s median Quality, Valuation and Momentum (Q, V, M) and its top 3 stocks by quality. For example Financial Services: 148 stocks, Q 66, V 50, M 55. |
| Sector table | Opening a section shows its stocks with Quality, Valuation, Momentum and Checks (passed out of applicable, e.g. 13/16), sorted by quality. Tap a column header to sort; tap again to reverse. n/a always goes to the bottom. Click a stock to open its score page. |
The 18-point checklist: your homework list
The scores say where a stock ranks; the checklist asks plain yes/no questions with fixed thresholds that do not depend on other stocks.
| # | Check | When it is n/a |
|---|---|---|
| 1 | Profit up on a year ago (latest quarter) | No year-ago figure |
| 2 | Sales (income, for banks) up on a year ago | Not comparable |
| 3 | Profit up year on year in at least 6 of the last 8 quarters | Fewer than 4 comparable quarters, or not yet decided |
| 4 | ROE of 15% or more | No ROE |
| 5 | ROCE of 15% or more | Banks, NBFCs, insurers |
| 6 | Debt / equity under 0.5 | Banks, NBFCs, insurers |
| 7 | Interest cover of 3× or more | Banks, NBFCs, insurers |
| 8 | Positive free cash flow (latest full year) | Banks, NBFCs, insurers; no cash flow data |
| 9 | P/E below its sector median | Loss-making; no sector median |
| 10 | P/E below its own 5-year median | Loss-making; not an F&O stock (“no 5-year history”) |
| 11 | Price above its 200-day average | Under 200 days of trading |
| 12 | Price above its 50-day average | No data |
| 13 | RS rating of 70 or more | No rating |
| 14 | Promoter holding not reduced last quarter | No promoter group (e.g. HDFC Bank); no filing |
| 15 | FII + mutual fund holding up last quarter | No filing |
| 16 | Delivery % (60 days) above the market median | No data |
| 17 | Not under ASM / GSM surveillance | Never |
| 18 | Not in the F&O ban list | Not an F&O stock |
An n/a check counts neither as a pass nor as a fail; it simply drops out of the total. That is why you see “12 of 18” for one stock and “10 of 13” for another.
How to use it as homework
- Every Fail is a question, not a verdict. Reliance fails “ROE of 15% or more” (9.0%). Why? New investment not yet earning is a different story from a declining business. Read the quarterly results.
- Holdings checks need context. HDFC Bank fails check 15 (FII + MF down 1.17 points), yet mutual funds raised their stake by 1.3 points while FIIs cut 2.4. See shareholding changes.
- Trading checks are safety checks. Checks 17 and 18 tell you whether special exchange rules apply. See ASM / GSM stocks and the F&O ban list.
- Do not count passes like marks. Which checks fail matters more than how many.
Worked examples with real numbers (prices of 9 Nov 2026)
All figures are from the live pages built with prices of 9 Nov 2026. They will have changed by the time you read this.
1. Reliance Industries: average on everything
Close ₹1,324.40. Scores: Quality 44 (Average), Valuation 53 (Fair), Momentum 57 (Neutral); passes 12 of 18 checks.
- Valuation pulls both ways. P/E 21.8 is 1.66× the Oil & gas median of 13.2 (percentile 25) but 0.90× its own 5-year median of 24.2 (percentile 62); FCF yield 3.9% ranks 77. Average: 53.
- Momentum is mixed. 7.1% above its 50-day average (percentile 86), but only 0.1% above its 200-day, 37% up its 52-week range and 9.8 points behind NIFTY 50 over six months.
- Sector rank: #26 of 34 in Oil & gas for quality.
Lesson: a middle score often hides strong and weak parts that cancel out. Always open “How scores are made”.
2. HDFC Bank: strong quality, falling price
Close ₹798.15, down 18.94% over the past year against −1.82% for NIFTY 50, and 21.6% below its 52-week high. Yet its scores were Quality 76 (Strong), Valuation 60 (Fair), Momentum 61 (Neutral).
- Quality uses only two parts for a bank: ROE 14.4% (percentile 57) and profit up year on year in 8 of the last 8 quarters (percentile 94). (57 + 94) ÷ 2 = 75.5, shown as 76.
- Valuation: P/E 15.3 against a Financial Services median of 17.8 (0.86×) and against its own 5-year median of 19.5 (0.79×).
Lesson: a Strong quality score did not stop a 19% fall. Quality describes the business; the price also depends on expectations, interest rates, FII selling and more. TCS that day: Quality 88, 16 of 18 checks, share down 17.79% over the year.
3. KRBL (small-cap, not in F&O): high on all three
Close ₹405.10. One of only 19 stocks scoring 67+ on every pillar: Quality 78, Valuation 88, Momentum 74; 13 of 16 checks (2 n/a).
- Quality: almost no debt (D/E 0.01), interest cover 159×, profit up in 7 of the last 8 quarters, free cash flow margin 14.2%.
- Valuation: P/E 11.0 against an FMCG median of 24.1 (0.46×), P/B 1.49 against 3.10. Only 3 of 4 parts: as a non-F&O stock it has no own 5-year P/E, so we do not know whether it is cheap against its own past. FMCG medians are pulled up by premium brands; a rice company may always trade below them.
- The checklist flags homework: ROE 14.4% just misses 15%, FII + MF holding fell 0.30 points to only 7.1%, and delivery (42%) is below the market median (48%).
Lesson: even a stock that tops all three scores has open questions.
4. Eternal (Zomato) and Yes Bank: valuation and momentum disagree
| Stock | Quality | Valuation | Momentum | Price story (9 Nov 2026) |
|---|---|---|---|---|
| Eternal (Zomato) | 36 | 16 (Expensive) | 91 (Strong) | 98% of the way up its 52-week range; P/E 673.1 vs a sector median of 33.8 |
| Yes Bank | 60 | 82 (Inexpensive) | 12 (Weak) | Down 24.75% over the year; #144 of 148 in Financial Services for momentum |
This is normal: a big rise makes a stock look expensive, a big fall makes it look cheap. Momentum and valuation are often two sides of the same move, and neither says which side wins next.
Step by step: researching one stock with scores (15 minutes)
- Open the stock page from the stock monitor; note the three scores and sector ranks on the card.
- Open the full score page and check the “Prices as of” date and the results quarter.
- Look at the “From X of Y components” line. A score built from 2 parts is shakier than one built from 6.
- Open “How scores are made”. Find the strongest and weakest part in each pillar. Write them down.
- Read the checklist. List every Fail and every n/a. Each one is a question to research.
- Check the sector section: above or below the median? Who leads, and why?
- Do the homework. Read the latest results, shareholding and delivery data for the questions you wrote down.
- Then look at the chart and decide whether it belongs on your watchlist.
Three playbooks
Playbook A: quality first, then valuation (long-term investors)
- On Stock scores, open a sector you understand (its table is sorted by quality), or glance at the Quality tab of Highest scores.
- Shortlist stocks with Quality 67+ built from most of their parts (5 or 6 of 6; 2 of 2 for lenders).
- Now look at Valuation. Among the strong-quality names, note which are Fair or Inexpensive and which are Expensive. An Expensive score is not a “no”; it means the market already expects a lot.
- Open each score page and work through the checklist fails.
- Cross-check with high ROE stocks, debt-free stocks and low P/E stocks.
Playbook B: momentum confirmation (swing traders)
- Start from your own setup (a breakout, a scanner signal).
- Check the momentum score and its parts: above the 200-day and 50-day averages, RS rating 70+, upper half of the 52-week range. A Strong momentum score means the trend is on your side; a Weak one means you are trading against it.
- Plan the trade with a stop loss and size it with the position size calculator. Momentum can reverse in a day; the score from yesterday’s close will not warn you.
Playbook C: compare peers with sector rank
- On a stock page, read the sector rank on the score card, for example KRBL was #9 of 84 in FMCG for valuation and #11 of 88 for quality.
- On the score page, open the Sector section and compare the stock’s scores with the sector median and the top 5.
- On the index, open the sector’s section to see every peer and its median scores, and sort by the pillar you care about.
- Compare like with like, and ask whether the business really matches its sector label.
None of these playbooks is a buy or sell signal. They are ways to decide what to research. Always use a stop loss and never put more money into one idea than you can afford to lose.
Common mistakes
- Treating 80 as “buy”. A score is a rank of past and current numbers, not advice and not a forecast. HDFC Bank (Quality 76) and TCS (Quality 88) were both down about 18–19% over the year to 9 Nov 2026.
- Comparing scores across sectors blindly. Valuation is measured against each stock’s own sector, so “Inexpensive” in FMCG and “Inexpensive” in Oil & gas mean different P/Es. Lenders’ quality is built from 2 parts, other companies’ from up to 6.
- Ignoring n/a. A missing valuation score does not mean “cheap” or “expensive”; it means not enough data (usually a loss-maker). A checklist n/a is not a pass.
- Chasing the strongest momentum without a stop. Eternal sat at 98% of its 52-week range on 9 Nov; the score says nothing about how long a run lasts.
- Buying “cheap” without asking why. A high valuation score can mean the market expects trouble. Yes Bank scored 82 on valuation and 12 on momentum.
Checklist before you act on a score
- The “Prices as of” date is the latest trading day, and the results quarter is recent.
- Each score uses most of its possible parts (see “From X of Y components”).
- You have read the parts behind each score, not just the total.
- You know why the stock fails each checklist point it fails, and what every n/a means.
- You compared it with its sector median and its top peers, not with stocks from other sectors.
- Valuation and momentum disagreement (if any) is understood: is it cheap because it is falling, or expensive because it is rising?
- No ASM/GSM surveillance and no F&O ban (checks 17 and 18), or you know the extra rules.
- For any trade: entry, stop loss and position size are decided first.
Glossary
| Percentile | The share of other scored stocks a number beats, from 0 to 100. |
| ROE / ROCE | Profit on shareholders’ money / on all capital including borrowings. |
| Free cash flow (FCF) | Operating cash flow minus capital spending. |
| P/E | Share price ÷ earnings per share of the last four quarters. |
| P/B | Share price ÷ book value per share. |
| RS rating | Relative strength rating, 1–99: 12-month return ranked against all tracked NSE stocks. |
| Sector rank | The stock’s position among scored stocks of its sector for one pillar, e.g. “#19 of 66”. |
| n/a | Not available: the measure does not apply or the data is missing; it counts neither way. |
| ASM / GSM | NSE’s additional and graded surveillance measures for stocks with unusual price or volume moves. |
Questions
What is a stock quality score?
On ChartMine it is a 0–100 rank of how a company’s ROE, ROCE, debt, interest cover, profit growth consistency and free cash flow margin compare with about 1,300 other NSE stocks. Banks, NBFCs and insurers use ROE and profit consistency only. A higher score means better numbers than most stocks, not a good investment.
How is the ChartMine stock score calculated?
Each part is turned into a percentile (the share of other scored stocks it beats) and each score is the average percentile of its parts. Quality, valuation and momentum each need a minimum number of parts. Scores are labelled strong or inexpensive at 67 and above and weak or expensive at 33 and below.
Is a high stock score a buy signal?
No. A score ranks today’s numbers against other stocks; it is not a forecast or advice. On 9 Nov 2026 HDFC Bank had a quality score of 76 while its shares were down about 19% over the year. Score history only began on 10 Nov 2026, so the scores have not been tested as a predictor.
Why is the valuation score n/a for some stocks?
Valuation needs at least two parts. It is n/a when the company made a loss over the last four quarters, or when only one of the four parts is available, for example a stock whose sector is not classified and which is not in F&O. On 9 Nov 2026, 91 of 1,324 scored stocks were n/a, 75 of them loss-makers.
Why do valuation and momentum scores often disagree?
A price that has risen a lot pushes momentum up and makes the stock look more expensive; a price that has fallen does the opposite. So a stock can be Strong on momentum and Expensive on valuation at the same time, as Eternal was on 9 Nov 2026.
How often are stock scores updated?
Every trading day with the latest closing prices. Valuation and momentum move with prices daily; quality changes mostly when new quarterly results or annual balance sheets are filed.
Why does a bank have fewer checklist points?
Checks on ROCE, debt/equity, interest cover and free cash flow do not fit lenders, so they are n/a for banks, NBFCs and insurers. They count neither way, which is why HDFC Bank shows 10 of 13 applicable checks.