
☰ All tutorials
Start here
Tool tutorialsHow to trade with ChartMineStocks
Stock monitorMy watchlistStock scores & checklistMarket & sectors
Nifty 50Bank NiftySensexFin NiftyDaily market reportMarket breadthSector rotationSector heatmapStock screenerRelative strength (RS)MCX commodity pricesFear & Greed IndexWhat happens after…Scanners
Top gainers & losersStocks to watch tomorrowNR7 stocks scannerInside bar stocks52-week high stocksGap up & gap down stocksRSI oversold stocksGolden cross stocksSuperTrend buy stocksScan builderEMA 9/21 crossoverMACD crossoverADX strong trendBollinger breakout / squeezeVolume spike stocksOpen = high / open = lowCandlestick pattern scannerNarrow CPR scannerF&O data
F&O ban listOI build-upOption chainPCR & max painExpiry calendarF&O lot sizesOI build-up heatmapPCR trendMax pain trendFutures basisStock screens
Quarterly growersProfit growth stocksLow P/E stocksMutual fund buyingNear 52-week low, growingDebt-free companiesHigh ROE & ROCEMagic Formula stocksLow price-to-bookSmart money
FII / DII dataShareholding changesBig-money footprintShort selling dataF&O positions by participantBulk & block dealsPromoter buyingDelivery percentageCalendars
Results calendarQuarterly results trackerBoard meetingsCorporate actionsIPO calendarIPO performanceResearch & planning
Strategy testerCompare stocksDividend yield stocksASM / GSM listExpiry-day movesSeasonality & stock historyNSE holidays 2026Position size calculatorOption payoff calculatorPivot point calculatorMore
Stock scanners hubStock screensHow to use the Short selling data page
A plain-language guide to short selling in India: who is allowed to short and how, what NSE’s daily short-sale disclosure contains, how to read every part of the page, and what two years of data say about whether shorted stocks really fall.
What short selling is, in plain words
Most people make money in shares the obvious way: buy first, sell later at a higher price. Short selling flips the order. You sell first, at today’s price, shares you do not own, and buy them back later. If the price fell in between, you keep the difference. If it rose, you lose the difference.
A simple example. You sell 100 shares at ₹500 (you receive ₹50,000). Later the price is ₹470 and you buy 100 shares back for ₹47,000. Profit: ₹3,000, before charges. Had the price gone to ₹530 instead, buying back would cost ₹53,000: a ₹3,000 loss. A buyer can lose at most what they paid; a short seller’s loss has no ceiling, because a price can keep rising.
One line to remember: a short sale is a bet that the price will fall, or one leg of a hedge or arbitrage trade. The data on this page cannot tell you which.
The Short selling data page shows NSE’s official daily list of short sales in the cash market: which stocks were sold short, how many shares, what share of the day’s volume that was, and how often each stock has appeared over the last 20 sessions. It also keeps the full history since July 2024, so you can see what is normal before you read anything into one day.
How short selling works in India: who can short, and how
India allows short selling, but with one firm rule: no naked short selling. Whoever sells must deliver the shares on the settlement day (T+1, the next working day). That single rule shapes everything below.
SEBI’s short-selling framework (circular of 5 January 2024) adds two disclosure rules: institutions must flag a short sale when they place the order, and retail investors must disclose it by the end of that trading day. Brokers pass the details to the exchange before the next session opens. SEBI also bars institutions from day trading in the cash market. Check SEBI’s and NSE’s current rules for the latest details.
| Route | Who uses it | How it works | Shows up in NSE’s short-selling file? |
|---|---|---|---|
| Intraday short in the cash market | Retail traders, prop desks | Sell in the morning, buy back before the close. Your broker squares off any open short around 3:15–3:20 PM. If a short is left open and you cannot deliver, the exchange runs an auction to buy the shares for you, usually at a penalty price. | Only if reported as a short sale; most intraday squared-off trades leave no short position. |
| Institutional short sale | FPIs (foreign investors), mutual funds, insurers | Institutions are not allowed to day-trade in the cash market, so their short sale must be backed by borrowed shares. They must say it is a short sale upfront, when they place the order. | Yes. This is the core of the file. |
| SLB (Securities Lending and Borrowing) | Institutions, some HNIs; few retail brokers offer it | Borrow shares from a long-term holder through the exchange’s SLB platform for a fee, sell them, and return the same number of shares later (up to 12 months). | The sale that follows can be a reported short sale; the borrowing itself is published separately in SLB data. |
| Futures | Everyone with an F&O account | Sell a stock or index futures contract. No shares are borrowed or delivered until expiry, and the position can be held for weeks. | No. Futures shorts appear only as open interest (see OI build-up). |
| Buying put options | Everyone with an F&O account | A put gains when the price falls; the most you can lose is the premium. | No. |
So, in practice, a retail trader can short in the cash market only intraday. To stay short overnight, a retail trader uses futures or options. Big funds can short in the cash market only by borrowing first, and most of their bearish bets are placed in futures, which this file never sees.
Why that matters for the data: NSE’s file is a narrow window. On a normal day it lists a few lakh shares across the whole market, a tiny fraction of what trades. On 5 Nov 2026, 142 stocks appeared with a total of 2.17 lakh shares. Mahindra & Mahindra was on the list with 212 shares, on a day when about 89 lakh M&M shares traded.
What NSE’s daily disclosure contains (and when it arrives)
Brokers collect short-sale details from their clients and upload them to NSE. NSE publishes one file per day in its public archive. ChartMine downloads it every evening and stores it by trade date.
| Field in NSE’s file | Meaning |
|---|---|
| Security name and symbol | The stock (or ETF) that was sold short. ETFs like LIQUIDBEES or NIFTYBEES also appear. |
| Trade date | The session in which the short sale was made. |
| Quantity | Total shares sold short in that stock that day, all reporting clients added together. |
That is all. The file does not say who sold, at what price, whether the short was later covered, or whether it was a hedge. ChartMine adds the context you see on the page: the share of the day’s total traded quantity (from NSE’s bhavcopy), the price change that day, and the running 20-session count.
The one-day delay
The file named for a day lists the previous session’s trades. So on Monday evening you see Friday’s short sales; on Tuesday evening, Monday’s. The page always says which date it shows (for example “Short sales on 5 November 2026”). Treat it as yesterday’s news, not a live feed.
How big is a “normal” day?
We looked at all 573 trading days in the history (Jul 2024 to 5 Nov 2026), 43,258 stock-day entries in total:
- A typical day lists about 73 stocks (median).
- The typical entry is just 100 shares (median). Nine in ten entries are about 6,300 shares or fewer.
- As a share of the stock’s traded volume, the median entry is 0.005%. Only about 4% of entries reach 1% of the day’s volume.
- The largest single entry was 4.14 crore shares of Vodafone Idea on 1 Apr 2026.
So the small entries are background noise. The rare large ones are where the information is.
Why traders look at it: advantages and limits
✅ Official, free, daily
It comes straight from NSE. No guesswork about whether institutions sold short in the cash market: they had to declare it.
✅ Spots unusual days
A stock that suddenly shows crores of shares sold short, or 5–15% of its volume, stands out against its own history.
✅ Context for a fall
When a stock drops sharply, you can check whether disclosed short selling was part of it, or whether it was ordinary selling by holders.
✅ Two years of history
The chart and the 20-session table show what is normal, so you do not over-read a single day.
The limits (please read this part)
We tested whether appearing on the list predicted a fall. We took every short-sale entry from Oct 2024 (where our price history starts) to Oct 2026 and compared the stock’s next 5 and 20 sessions with the median stock on the same day.
| Group | Cases | Higher after 20 sessions | Did better than the median stock |
|---|---|---|---|
| Any stock on the list | 40,812 | 47% | 52% |
| Short sales of 0.5% of the day’s volume or more | 2,654 | 44% | 50% |
| Shorted on 8 or more of the last 20 days | 12,440 | 45% | 51% |
In plain words: being shorted did not make a stock underperform in this period. Heavily or repeatedly shorted stocks did about as well as an ordinary stock on the same day, a coin toss. (The “higher after 20 sessions” column is below 50% for every group, including ordinary stocks, because the period included long falls; that is why we compare with the same-day median.)
- Most short sales are not bets. Funds sell borrowed shares in the cash market while buying futures (or the reverse) to lock in a price gap: arbitrage. Others hedge a portfolio. Neither is a view that the price will fall.
- Short sales cluster on F&O expiry days. On the 54 monthly expiry days in the history, a median of 100 stocks and 11.8 lakh shares were disclosed, against 73 stocks and 2.8 lakh shares on other days. That is arbitrage and hedges being rolled or closed, not a wave of bearishness.
- The file misses the big bearish bets, which are placed in futures and options.
- No covering data. You never see when the short was bought back.
So how should you use it? As a context and anomaly check, never as a sell signal on its own. A one-off, very large entry tells you something unusual happened that day; find out what (news, block deals, OFS, results) before drawing conclusions.
A tour of the Short selling data page
Open the Short selling data page. From top to bottom: four summary cards, the day’s short sales, the 20-session table, and the history chart.
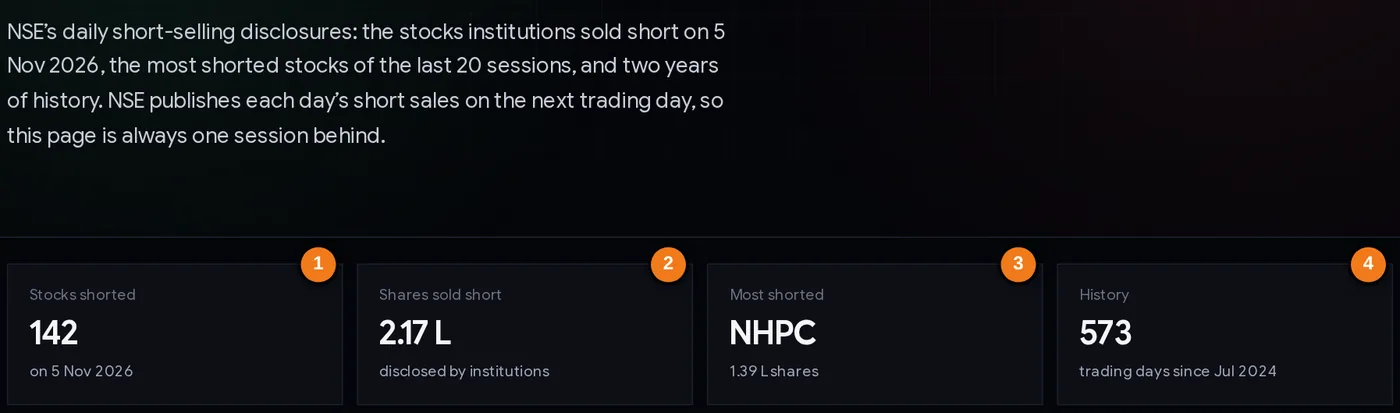
- 1Stocks shorted: how many stocks appear in NSE’s file for that trade date.
- 2Shares sold short: total quantity across all stocks (L = lakh).
- 3Most shorted: the stock with the largest quantity that day.
- 4History: trading days stored since July 2024.
The headline number to sanity-check first is Shares sold short. A few lakh is a normal day. Tens of lakhs or crores usually means one or two stocks had a very large entry (or it was an expiry day); look at the table to see which.
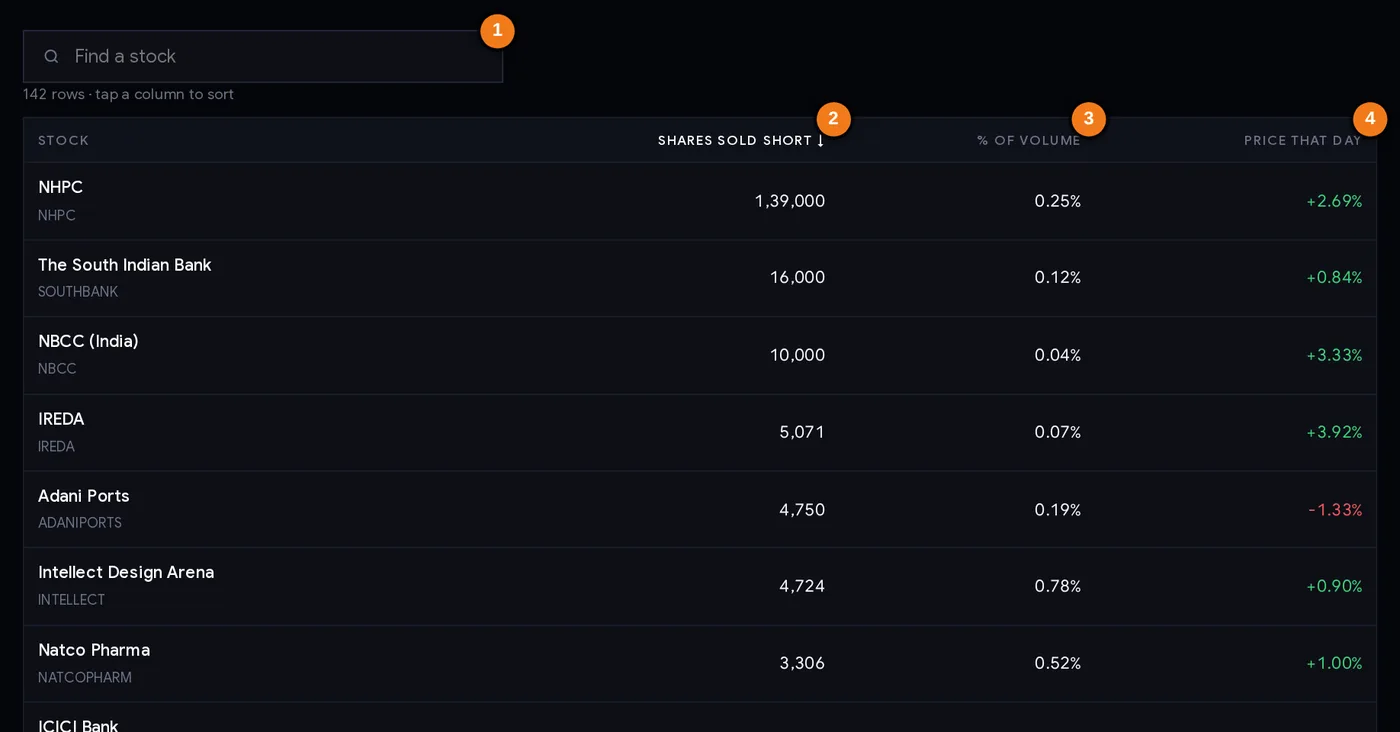
- 1Find a stock by name or symbol.
- 2Shares sold short that day.
- 3Share of the stock’s total traded quantity (the column that matters).
- 4The stock’s price change that day.
The day’s table, column by column
| Column | What it tells you |
|---|---|
| Stock | Company name and NSE symbol. Click to open the stock’s ChartMine page with its chart, delivery history and futures data. |
| Shares sold short | Quantity in NSE’s file for that trade date, in Indian format (1,39,000 = 1.39 lakh). The table is sorted by this column by default. |
| % of volume | Shares sold short ÷ the stock’s total traded quantity that day × 100. This is the column that matters: 100 shares means nothing in a stock that trades crores of shares; 5% of the day’s volume is unusual. |
| Price that day | The stock’s close-to-close change that day. Green for up, red for down. Shorts on an up day are often arbitrage or hedges. |
Click any column header to sort by it. Sorting by % of volume is the quickest way to see where short selling was a meaningful part of the trading. Use Find a stock to check one symbol.
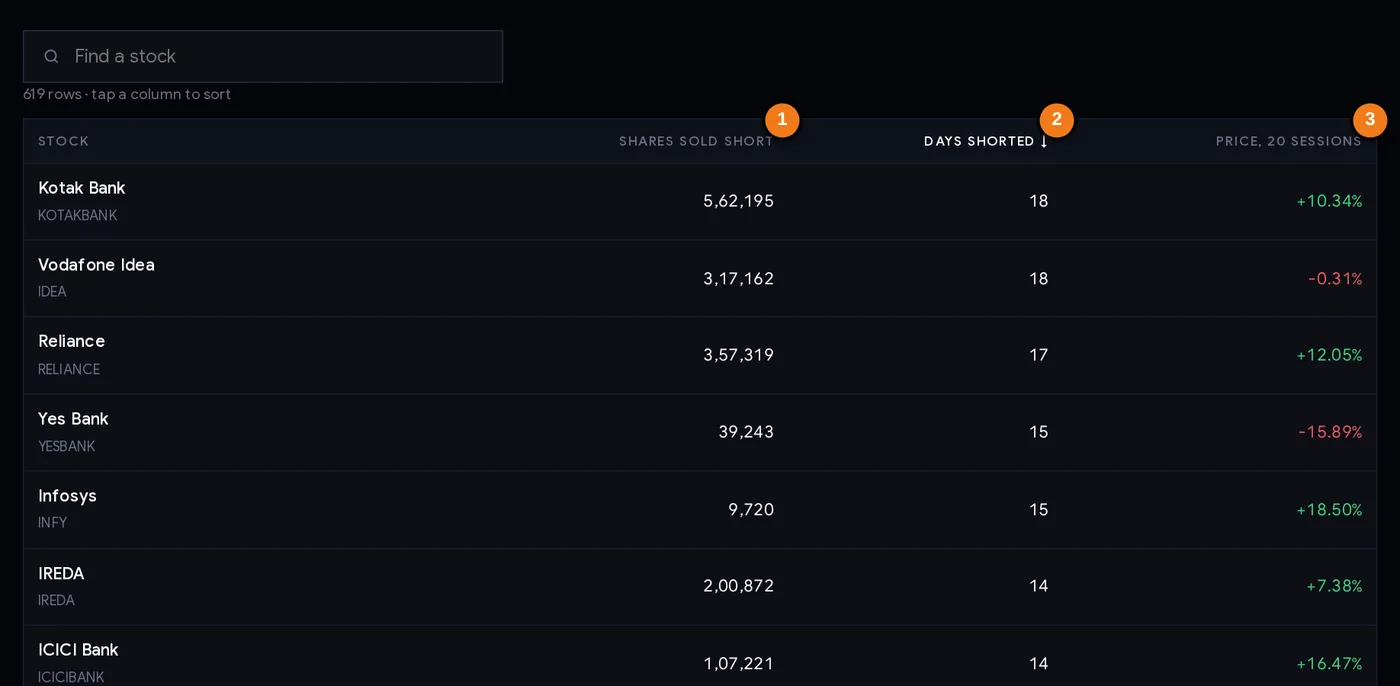
- 1Total shares sold short in 20 sessions.
- 2Days shorted out of 20.
- 3Price change over the stock’s last 20 sessions.
The 20-session table
| Column | What it tells you |
|---|---|
| Shares sold short | Total over the last 20 disclosure days. |
| Days shorted | On how many of those 20 days the stock appeared. The table is sorted by this, so the most persistently shorted names are at the top. |
| Price, 20 sessions | The stock’s price change over its last 20 trading sessions up to the latest close. Compare it with NIFTY over the same weeks. |
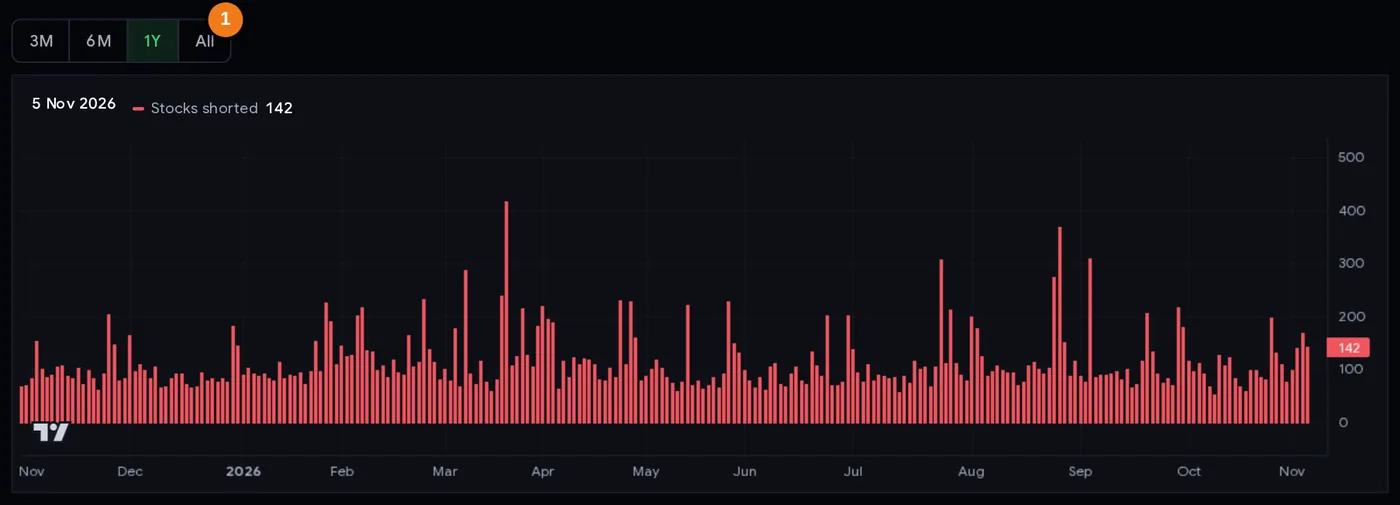
- 1Range buttons: 3 months, 6 months, 1 year or the full history since July 2024.
The chart counts how many stocks had short sales disclosed each session. Use the 3M / 6M / 1Y / All buttons to change the range. Many of the tallest bars fall on monthly F&O expiry days (17 of the 40 busiest days in the history); the median day since July 2024 lists 73 stocks.
Step by step: a 10-minute evening check
- Check the date. The heading says which trade date you are looking at; it is always the previous session.
- Read the summary cards. Is the number of stocks and shares normal (about 70–150 stocks, a few lakh shares)? Was the day a monthly F&O expiry? Then expect a bigger list.
- Sort the day’s table by % of volume. Ignore entries far below 0.5%. Note anything above 1–2% of the day’s volume.
- Look at the price column for those names. A big short sale on a sharp fall is worth a closer look. A big short sale on an up day is more often arbitrage.
- Find the reason. Open the stock’s page and check bulk and block deals, results, corporate actions and news. A sale by a large holder, an OFS (offer for sale) or results often explain the day.
- Check the futures. On the OI build-up page, see whether futures open interest rose with the fall (short build-up). That is where most real bearish positioning shows.
- Scan the 20-session table. See which of your stocks appear on many days, and compare their 20-session price change with NIFTY’s.
- Write down what you saw, not what you guess. “ABC: 3% of volume sold short on a −4% day, short build-up in futures, results next week” is useful. “Institutions are dumping ABC” is a guess.
Three ways traders use short-selling data
Playbook A: the anomaly alert
Once a week, sort the day’s table by % of volume and look for one-off entries of 5% or more. For each, ask: was there a block deal, an OFS, a results announcement, or an index change? If you find a clear reason, you learned how the market absorbed it. If you find none, add the stock to a watchlist and watch the next few sessions’ price, delivery and futures open interest before forming any view. Never take a trade on the entry alone.
Playbook B: confirm, do not originate
You already have a bearish idea from your own analysis: a broken support, weak results, short build-up in futures. The short-selling data is one more piece of evidence, not the reason. If disclosed short selling is also unusually high, it agrees with your view; if it is absent, nothing changes, because most bearish positioning happens in futures anyway. Size the trade on your stop loss, not on the data.
Playbook C: the short-squeeze watch
Short sellers must buy back eventually. When a stock that was heavily shorted starts rising on good news, the buying-back can speed up the move: a short squeeze. In Indian cash markets this is rarer than in the US, because cash shorts by institutions are small and backed by borrowed shares; but a stock that keeps appearing with large entries and keeps rising tells you the shorts are under pressure. Watch it with the OI build-up page: short covering (price up, OI down) confirms it.
Risk first, always. If you short through futures, the loss on a rising price has no ceiling until you exit. Decide your stop loss before the trade and use the position size calculator to keep the possible loss to a small part of your capital (for example 0.5–1%).
Case studies from the data
Five real examples from NSE’s files and bhavcopy, picked to show what the data can and cannot tell you. Prices in ₹.
1. A normal day: 5 Nov 2026
142 stocks, 2.17 lakh shares in total. The top entry was NHPC with 1.39 lakh shares, just 0.25% of the 5.57 crore NHPC shares traded, on a day it rose 2.69%. ICICI Bank appeared with 2,834 shares (0.01% of volume) on a +5.33% day. Lesson: most days, the list is small change compared with total trading. Always read the % of volume column.
2. Vodafone Idea, 1 Apr 2026: the biggest entry, and the price rose
4.14 crore shares were disclosed as short sales, 6.23% of the 66.5 crore shares traded. The stock still closed up 1.29% at 8.64. Five sessions later it was at 9.12 (+5.6%); twenty sessions later at 10.52 (+21.8%). Lesson: the largest short sale in two years of data was followed by a strong rise. A big number is not a forecast.
3. NHPC, 2 Jun 2026: heavy shorting on a sharp fall
3.23 crore shares sold short, a remarkable 15.2% of the day’s volume, while the stock fell 6.36% to 72.29. The next day it bounced 3.89%, and 20 sessions later it stood at 79.57 (+10.1%). Our data does not show the reason for that day’s selling. A one-off spike of this size usually has a specific cause (a large holder selling, an arbitrage trade, an event), so the right reaction is to find it, not to follow it.
4. The expiry effect: 27 Oct 2026
On the October monthly F&O expiry, 198 stocks and 23.3 lakh shares were disclosed. The day before (26 Oct): 81 stocks and 1.40 lakh shares. The day after (28 Oct): 132 stocks and 4.53 lakh. Across all 54 monthly expiries in the history the pattern repeats: about four times the usual quantity. Lesson: do not read a crowded expiry-day list as a bearish signal; it is mostly arbitrage and hedges being closed or rolled.
5. The most persistently shorted names: 8 Oct to 5 Nov 2026
The 20-session table on 6 Nov was led by Kotak Bank and Vodafone Idea (18 of 20 days each), Reliance (17), and Yes Bank and Infosys (15 each). Over their last 20 sessions Kotak Bank rose 10.3%, Reliance 12.1% and Infosys 18.5%, while Yes Bank fell 15.9% and Vodafone Idea was flat. NIFTY rose about 12% in the same weeks. Lesson: the names shorted most often are mostly large, liquid F&O stocks, the ones arbitrage desks trade every day. Frequency alone told you nothing about direction.
Common mistakes
- Reading “shorted” as “will fall”. Our two-year test: shorted stocks did about as well as the median stock.
- Ignoring % of volume. 10,000 shares can be huge in a small company and nothing in a large one.
- Forgetting the one-day delay. The list is for the previous session; the market has already reacted.
- Panicking on expiry days. Lists are about four times bigger then, for mechanical reasons.
- Thinking this is all the shorting. Most bearish positions are in futures and options; check open interest too.
- Shorting overnight in the cash market as a retail trader. You cannot carry it: an undelivered short goes to auction, usually at a penalty price.
- Shorting without a stop loss. A short position’s loss has no ceiling.
Checklist before you read anything into a short-sale entry
- I know which trade date the list is for (the previous session).
- I checked whether that day was a monthly F&O expiry.
- The entry is large relative to the stock’s volume (roughly 1% or more), not just a big-looking number.
- I checked the price move that day and the next.
- I looked for a reason: block or bulk deal, OFS, results, index change, news.
- I checked futures open interest for short build-up or short covering.
- Any trade idea comes from my own analysis, with a stop loss and position size decided first.
Glossary
| Short selling | Selling shares you do not own, planning to buy them back later. |
| Naked short selling | Selling short without being able to deliver the shares. Not allowed in India. |
| Covering | Buying back shares to close a short position. |
| Short squeeze | A fast rise driven partly by short sellers buying back to limit losses. |
| SLB | Securities Lending and Borrowing: borrowing shares through the exchange for a fee, to deliver against a short sale. |
| Auction | What the exchange does when a seller fails to deliver: it buys the shares in a special session and charges the defaulter. |
| Arbitrage | Buying in one market and selling in another (e.g. cash and futures) to lock in a small price gap. |
| Hedge | A position taken to reduce the risk of another position, not to bet on direction. |
| F&O expiry | The day futures and options contracts end. Stock F&O expire monthly, on the last Tuesday in 2026. |
| Open interest (OI) | The number of futures or options contracts still open. Rising OI on a falling price = short build-up. |
| % of volume | Shares sold short ÷ total shares traded that day × 100. |
| FPI / DII | Foreign portfolio investors; domestic institutional investors (mutual funds, insurers, banks). |
Questions
What is short selling data in the Indian stock market?
It is NSE’s daily list of short sales in the cash market: for each stock, how many shares were sold by investors who did not own them, as reported by brokers. Institutions must declare a short sale when they place the order. NSE publishes each day’s list on the next trading day.
Can retail investors short sell stocks in India?
Yes, but in the cash market only intraday: the position must be bought back the same day, or the broker squares it off. An undelivered short goes to the exchange auction, usually at a penalty price. To hold a short position overnight, retail traders use futures or put options, or borrow shares through SLB where a broker offers it.
Does high short selling mean a stock will fall?
No. In ChartMine’s test of about 40,000 short-sale entries from Oct 2024 to Oct 2026, shorted stocks, even heavily or repeatedly shorted ones, did about as well as the median stock over the next 20 sessions. Much short selling is arbitrage or hedging.
Why is today’s short selling data not available?
NSE releases each session’s short-selling file on the next trading day. Monday’s short sales appear on Tuesday evening, so the latest list is always one session old.
Why are the short selling numbers so small?
Because naked short selling is banned and institutions cannot day-trade in the cash market, a cash short sale needs borrowed shares. Most large bearish bets are placed in futures and options instead, and those never appear in this file.
Why do so many stocks appear on F&O expiry days?
Arbitrage and hedge positions that pair cash shares with futures are closed or rolled at expiry. Over 54 monthly expiries, the median list had about four times the usual quantity of shares.
What is SLB in the stock market?
Securities Lending and Borrowing: a platform where long-term holders lend shares for a fee and borrowers use them, for example to deliver against a short sale. The borrower must return the same number of shares at the end of the agreed period.