
☰ All tutorials
Start here
Tool tutorialsHow to trade with ChartMineStocks
Stock monitorMy watchlistStock scores & checklistMarket & sectors
Nifty 50Bank NiftySensexFin NiftyDaily market reportMarket breadthSector rotationSector heatmapStock screenerRelative strength (RS)MCX commodity pricesFear & Greed IndexWhat happens after…Scanners
Top gainers & losersStocks to watch tomorrowNR7 stocks scannerInside bar stocks52-week high stocksGap up & gap down stocksRSI oversold stocksGolden cross stocksSuperTrend buy stocksScan builderEMA 9/21 crossoverMACD crossoverADX strong trendBollinger breakout / squeezeVolume spike stocksOpen = high / open = lowCandlestick pattern scannerNarrow CPR scannerF&O data
F&O ban listOI build-upOption chainPCR & max painExpiry calendarF&O lot sizesOI build-up heatmapPCR trendMax pain trendFutures basisStock screens
Quarterly growersProfit growth stocksLow P/E stocksMutual fund buyingNear 52-week low, growingDebt-free companiesHigh ROE & ROCEMagic Formula stocksLow price-to-bookSmart money
FII / DII dataShareholding changesBig-money footprintShort selling dataF&O positions by participantBulk & block dealsPromoter buyingDelivery percentageCalendars
Results calendarQuarterly results trackerBoard meetingsCorporate actionsIPO calendarIPO performanceResearch & planning
Strategy testerCompare stocksDividend yield stocksASM / GSM listExpiry-day movesSeasonality & stock historyNSE holidays 2026Position size calculatorOption payoff calculatorPivot point calculatorMore
Stock scanners hubStock screensHow to use the Big-money footprint
A plain-language tutorial on spotting large investors in public NSE data: the four signs the page combines, how to read the bubble map and the list, three playbooks, real case studies, and an honest two-year test of what followed footprint days.
What the big-money footprint is, in plain words
Large investors such as mutual funds, insurance companies, foreign funds and promoters cannot hide completely. When they buy a big position, they leave marks in the public data: more shares delivered than usual, a jump in volume, new positions in the futures market, sometimes a named bulk or block deal.
Each mark on its own is weak. A volume spike can be day traders. A bulk deal can be a high-frequency trading firm buying and selling the same shares within minutes. The Big-money footprint page looks for stocks where two or more of these marks appear on the same day, together with a higher close. The idea is simple: several independent clues pointing the same way are more interesting than one.
Every evening the page checks about 1,400 NSE stocks and shows the matches on a bubble map and in a table, along with a test of what happened after similar days in the past.
One line to remember: a footprint shows where big money was active today. In our two-year test it did not predict higher prices on its own. Treat it as a list of stocks worth a closer look, never as a buy list.
The four signs, one by one
The page checks four signs for every stock. A stock appears when it shows at least two of them and closed higher than the day before.
| Sign | Exact rule | What it suggests | How it can mislead |
|---|---|---|---|
| 1. Big-buyer day | Delivered shares at least 3× the median of the previous 50 sessions, with delivery % at least three-quarters of usual (see the delivery tutorial). | Many shares changed owners, not just intraday churn. | Every delivered share has a seller; it can be a big exit. When one seller’s disclosed deal explains the spike, the page does not count it (see below). |
| 2. Up 2%+ on 2× volume | Price up at least 2% and volume at least twice the average of the previous 20 sessions. | Buyers were willing to pay up, in size. | Results, news or a market-wide rally lift many stocks at once. |
| 3. F&O long build-up | Only for F&O stocks: the futures price rose and open interest (open contracts) rose the same day. | New long positions in futures, often from larger traders. | Futures positions can be hedges or arbitrage, and can be closed tomorrow. |
| 4. Bulk/block buying | A named buyer in NSE’s bulk or block deal file that day, excluding known high-frequency and proprietary trading firms. The ₹ crore value is shown, with each trade counted once even when NSE lists it as both a bulk and a block deal. | A real, named investor bought a large amount. | The seller may be a promoter or fund selling a much bigger amount. |
Why “two or more” and “a higher close”?
One sign appears on hundreds of stocks most days. Requiring two cuts the list to a few dozen. The higher-close rule keeps out stocks where heavy activity came with a falling price, because that is more often selling than buying. On 6 Nov 2026 the page found 27 stocks with two or more signs, one with three, and none with all four.
When a big-buyer day is really one seller
Many huge delivery days are a single holder selling a stake in a pre-arranged block. The shares are delivered, so the delivery rule fires, but that is one exit, not many buyers. So the page checks the deal files first: if one client’s net sale that day (sold minus bought back) is at least half of all delivered shares, it takes those shares out and tests the big-buyer rule again. If what is left is under 3× normal, the stock gets the note “block transfer” instead of the big-buyer sign. Day traders who sell and buy back the same shares do not trigger it.
Example: on 6 Nov 2026 JSW Cement delivered 1.996 crore shares, about 28× normal, and closed 0.7% higher. Synergy Metals Investments Holding sold 1.91 crore of them at ₹120.50 (₹230 crore), and Nomura Funds Ireland bought 1.2 crore. Without the seller’s shares, delivery was only about 1.2× normal. With the big-buyer sign removed, only the bulk-buying sign was left, so JSW Cement does not count as a footprint.
How the page scores them
The table is sorted by the number of signs, then by how far delivery ran above normal. More signs is not proof of anything; it only means more of the clues agreed.
Why traders use it: advantages and limits
✅ Four data sets in one view
Delivery, volume, futures OI and deal files normally live on four different pages. Here they are combined per stock.
✅ Filters out noise
High-frequency trading firms are removed from the deal sign, one-seller block transfers do not count as big-buyer days, and a single sign is not enough to appear.
✅ Shows money, not opinions
Everything comes from NSE’s own files. No tips, no forecasts.
✅ Honest history on the page
The page itself shows how past footprints did against ordinary days, so you can judge it for yourself.
The limits: what two years of data say
We tested the strongest combination the history allows: a big-buyer day together with a 2%+ rise on twice the usual volume (signs 1 and 2). We used NSE bhavcopy from 18 Oct 2024 to 6 Nov 2026 for about 1,400 stocks, with prices adjusted for splits and bonuses, and compared it with every ordinary stock-day.
| What followed | Footprint day (7,138 cases) | Any day (5,41,359) |
|---|---|---|
| Higher 5 sessions later | 45.8% | 46.5% |
| Higher 20 sessions later | 47.4% | 46.5% |
| Median move after 20 sessions | −0.74% | −0.79% |
| Average move after 20 sessions | +1.35% | +0.58% |
| Beat NIFTY 50 over 20 sessions | 48.5% | 46.4% |
In plain words:
- No meaningful edge. A footprint day was higher a month later 47.4% of the time, against 46.5% for any day. That difference is too small to matter after costs.
- The average is flattered by a few big winners. The average move (+1.35%) looks better than the baseline, but the median (the typical case) is almost identical. A handful of huge rallies pull the average up; most footprint days went nowhere special.
- Big-buyer days alone did a little better (49.9% higher after 20 sessions, see the delivery tutorial), and big-buyer days on falling prices did better still (51.2%). Adding “a strong up day” did not help.
- F&O stocks: big-buyer days in F&O stocks were higher after 20 sessions 53.7% of the time against 50.9% for any F&O stock-day: a small tilt, not a reliable signal.
We could not test signs 3 and 4 over two years: the deal archive on the site starts on 16 Oct 2026, and futures data cover only F&O stocks. For the same reason the history test uses the plain big-buyer rule, without the block-transfer check.
So how should you use it? As a research list: find out why big money was active, decide whether the chart and the business support an idea, and manage risk with a stop loss and a fixed position size. Two years of data say the footprint alone is close to a coin toss.
A tour of the page
Open Big-money footprint. It updates every trading evening after NSE publishes the day’s files. From top to bottom: summary cards, the footprint map, the list, and the history test.

- 1Stocks with two or more signs and a higher close.
- 2Stocks with all four signs.
- 3Stocks with three signs.
- 4Value of bulk/block buying today, excluding prop / HFT firms.
Watch the Footprints today count over a few weeks. On days when the whole market rallies, many stocks qualify for “up 2%+ on 2× volume” at once, and the count jumps. That is a market event, not 40 separate institutional campaigns.
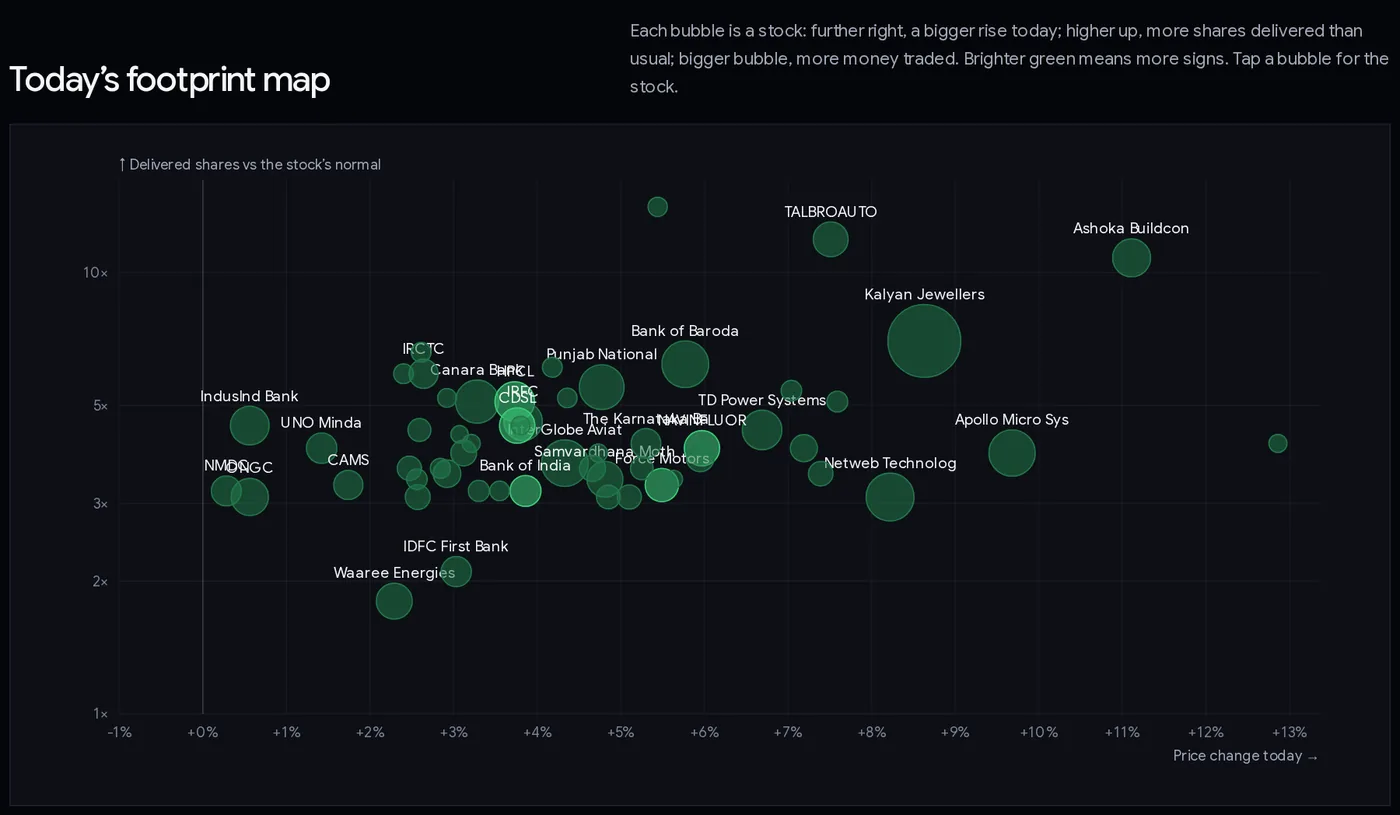
How to read the map
- Left to right: today’s price change. Further right = bigger rise.
- Bottom to top: delivered shares against the stock’s normal, on a stretched (logarithmic) scale: 1×, 2×, 3×, 5×, 10×, 20×.
- Bubble size: money traded today. A big bubble is a large, liquid stock.
- Brightness: brighter green = more signs.
- Tap a bubble to see the stock, its numbers and its signs.
The most interesting area is usually upper middle with a big bubble: heavy delivery, a solid but not crazy rise, and lots of money. Bubbles far to the right with small size are often small stocks on news, where one order can move the price.
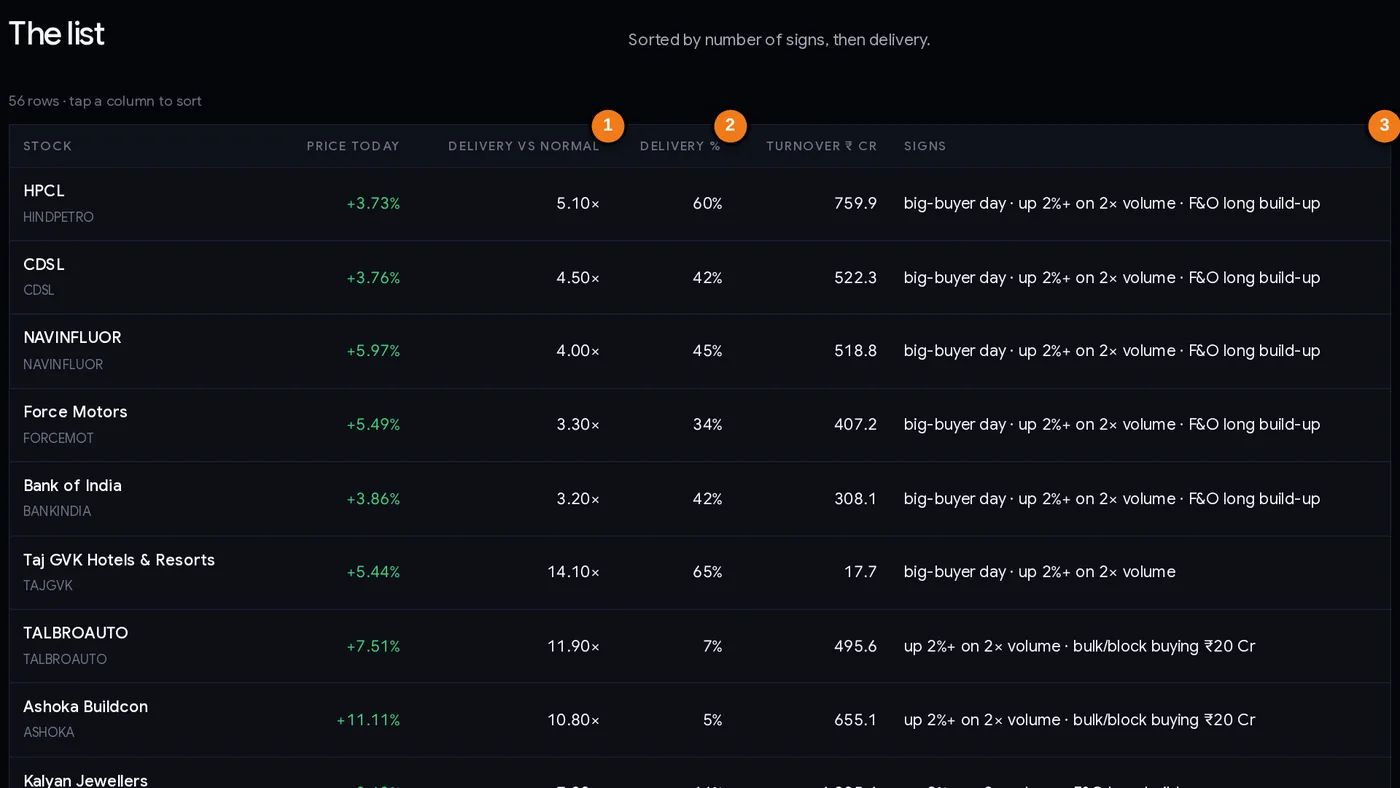
- 1Delivered shares against the stock’s 50-session normal.
- 2Share of today’s volume delivered.
- 3Which signs fired, with the bulk/block buying value.
Every column explained
| Column | What it tells you |
|---|---|
| Stock | Company and NSE symbol. Click to open the stock’s page. |
| Price today | Today’s % change (always positive here, because of the higher-close rule). |
| Delivery vs normal | Delivered shares ÷ the median of the previous 50 sessions. |
| Delivery % | Share of today’s volume that was delivered. A low % with a high multiple (for example 5%) means volume was huge and mostly intraday. |
| Turnover ₹ Cr | Value traded today. Under ₹10 crore, be careful: small orders can create signs. |
| Signs | Which of the four signs fired, with the bulk/block buying amount in ₹ crore. A “block transfer” note means the delivery spike came from one seller and was not counted. |
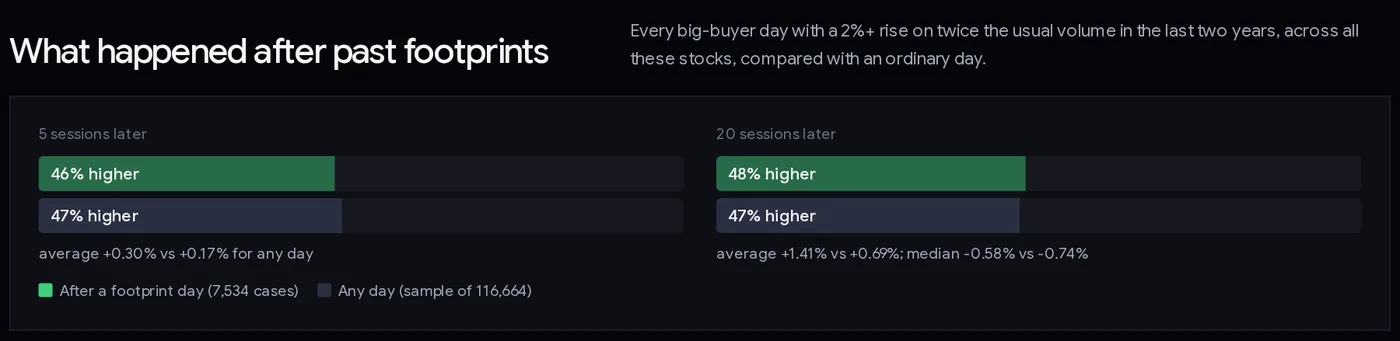
The last block repeats the history test on the live data: footprint days (green) against ordinary days (grey), 5 and 20 sessions later. It updates every day, so the numbers may move a little from the ones in this guide.
Step by step: your evening routine
- Open the page in the evening and check the date in the subtitle.
- Read the count. A normal day has a few dozen footprints. A big jump usually means a broad rally or a news day.
- Start with three or more signs, then two-sign stocks with large turnover. Skip tiny turnover names unless you specialise in small-caps.
- Find the reason. For a bulk/block sign, open bulk & block deals: who bought, and who sold? For an F&O stock, look at the OI build-up page. Check results and news.
- Check the seller side. If a promoter or early investor sold a large block, buyers absorbing it is normal and not necessarily bullish. The page already drops the big-buyer sign when one seller supplied most of the delivery, but a seller supplying, say, a third still counts.
- Open the chart. Is the stock breaking out of a range, bouncing from support, or simply jumping into resistance after a long run?
- Write the plan for any idea: entry condition, stop loss (for example below the footprint day’s low), position size. Most days, the right action is to just watch.
Three playbooks
Playbook A: the follow-through check (swing traders)
Do nothing on the footprint day. Note its high and low. Over the next 3–5 sessions, watch whether the price holds above the footprint day’s low. Many traders only consider an entry if the stock closes above the footprint day’s high while staying above that low, with the stop loss below the low. If the low breaks, drop the idea. This turns a coin-toss signal into a defined, limited-risk plan.
Playbook B: research the buyer (investors)
When the bulk/block sign shows a mutual fund, insurer or long-term foreign fund buying, investors use it as a prompt to study the company, not as a reason to buy. Read the latest results, check shareholding changes to see whether institutions have been adding over quarters, and look at valuation. Remember the institution may hold for years and can sit through a 30% fall; you may not want to.
Playbook C: the market-wide footprint day
When dozens of large stocks show footprints on the same day, read it as a market story. 20 Jun 2025 was such a day: 158 stocks had a big-buyer day, including Trent, Bharat Electronics and Reliance. On those days, look at the index and sector trend, not at individual names.
Position size first. Decide the maximum loss per trade (for example 0.5–1% of your capital), then use the position size calculator with your entry and stop loss.
Case studies from the data
Real footprint days (big-buyer day plus a 2%+ rise on twice the usual volume), from NSE bhavcopy. Prices in ₹. They show why the footprint is a starting point, not an answer.
1. BSE Ltd, 29 Sep 2026: the one that worked, after a scare
BSE rose 3.3% from 3,097.50 to 3,200 (closing at the day’s high), with ₹9,579 crore traded, 75% delivery and delivered shares 15.5× normal. The next day it closed at 3,092, below the footprint day’s open and low of 3,100. A stop loss under that low would have been hit. Five sessions later it was at 3,356, and 20 sessions later, on 29 Oct, at 3,502 (+9.4%). Lesson: even good footprints can shake you out. A stop placed a little below the day’s low, sized small, is part of the plan, and getting stopped out is part of the cost.
2. Infosys, 2 Jun 2026: a strong footprint that failed badly
Infosys jumped 5.7% from 1,202.50 to 1,270.80 with ₹4,552 crore traded and delivered shares 3.4× normal. It looked like classic institutional buying. The next day it closed at 1,222.60, back below the footprint day’s open. Twenty sessions later, on 1 Jul, it was at 985.30 (−22.5%). Lesson: a large, famous stock does not make the signal safer. The follow-through check in Playbook A would have kept you out: the price never held above the footprint day’s high.
3. 20 Jun 2025: when the whole market leaves footprints
Several large stocks qualified on the same day: Trent (+3.0% to 5,897.50, 18.4× normal delivery), Bharat Electronics (+2.4% to 408.25, 9.5×) and Reliance (+2.3% to 1,466.20, 3.3×). Twenty sessions later Trent was at 5,375 (−8.9%), BEL at 394.75 (−3.3%) and Reliance at 1,476 (+0.7%). Lesson: 158 stocks had a big-buyer day that session. When everything lights up together, the cause is market-wide, and it says little about any single stock.
4. Sagility, 14 Nov 2025: huge delivery, then a falling price
Sagility rose 5.6% to 53.28 on a day when more than 111 crore shares traded (₹5,457 crore), 75% delivered, 73.8× its normal delivery. Five sessions later it was at 48.47 (−9.0%), and 20 sessions later at 49.79 (−6.6%). A day that large usually means a big holder selling a stake to many buyers. On 30 Oct 2026, for example, Sagility B.V. sold 56 crore Sagility shares in a single bulk deal at ₹42.76, bought by foreign funds, a mutual fund and an insurer. Lesson: enormous delivery is often a stake sale. Check who sold before reading it as buying. (The 2025 day predates the site’s deal archive, so the page could not test it; on 30 Oct 2026 Sagility B.V. supplied 56 of the 58.6 crore delivered shares, but the remaining 2.6 crore were still about 4.4× normal, so that big-buyer day stood.)
5. ABB India, 6 Nov 2026: how to read a three-sign row
On 6 Nov 2026 ABB India was the only stock with three signs: a big-buyer day (delivery 4.2× normal, 47% delivered), a 2.2% rise on twice the usual volume, and F&O long build-up, with ₹512 crore traded. That is about as strong as the page gets on a normal day. Whether it works out was not known when this guide was written; the routine above is how you would follow it.
Common mistakes
- Reading “institutional buying” as a buy call. Our test: 47.4% of footprint days were higher a month later, about the same as any day.
- Ignoring the seller. Big blocks are often promoters or early investors selling (case 4).
- Trusting the average. A few huge winners make the average look good; the median was flat.
- Chasing the next morning. BSE and Infosys both opened lower the day after.
- Treating market-wide days as stock signals (case 3).
- Small-turnover stocks. A ₹3 crore day can produce two signs from a handful of orders.
- No stop loss because “big money is in”. Institutions can wait years; your capital may not.
Checklist before acting on a footprint
- The page date is the latest session; the footprint count is not a market-wide spike.
- Turnover is meaningful (ideally ₹10 crore or more).
- You know which signs fired, and the reason (deal, results, news, sector move).
- For a bulk/block sign, you checked who sold and how much.
- The chart supports the idea on its own.
- You waited for follow-through: the price held above the footprint day’s low.
- Entry, stop loss and position size are written down before you act.
Glossary
| Footprint | Two or more signs of large investors in the same stock on the same day, with a higher close. |
| Big-buyer day | Delivered shares 3× the 50-session median or more, with delivery % at least three-quarters of usual. |
| Block transfer | A delivery spike mostly explained by one seller’s disclosed deal (net sale at least half of delivered shares, and the rest under 3× normal). Not counted as a big-buyer day on this page. |
| Delivery | Shares that actually changed owners (not bought and sold within the day). |
| Open interest (OI) | The number of futures or options contracts still open. |
| Long build-up | Futures price up and open interest up: new long (buy) positions. |
| Bulk deal | A client’s trades in one stock in a day totalling more than 0.5% of its listed shares. |
| Block deal | A single large trade done in NSE’s separate block-deal window. |
| Prop / HFT | Proprietary and high-frequency trading firms that trade their own money very fast, often buying and selling the same shares within the day. |
| Median | The middle value; half the cases did better, half worse. |
| Follow-through | Price action in the days after a signal that confirms (or cancels) it. |
Questions
How do I find stocks with institutional buying today?
ChartMine’s Big-money footprint page lists every NSE stock that showed two or more signs of large investors on the latest trading day: heavy delivery, a 2%+ rise on twice the usual volume, futures long build-up, or bulk/block buying by non-HFT investors. On 6 Nov 2026 there were 27.
What is the big-money footprint?
A day when several independent signs of large investors appear in the same stock together with a higher close. It is built from NSE’s bhavcopy, F&O data and bulk/block deal files.
Does institutional buying mean a stock will go up?
No. In ChartMine’s test over 18 Oct 2024 to 6 Nov 2026, footprint days were higher 20 sessions later 47.4% of the time, against 46.5% for any day. Large buyers can be early, wrong, or buying from an even larger seller.
What is the difference between big-money footprint and high delivery stocks?
High delivery stocks looks at one sign, delivery, for every stock. The footprint page combines delivery with volume, futures open interest and named bulk/block deals, and shows only stocks where at least two signs agree on a rising day.
Why are HFT firms excluded from the bulk buying sign?
High-frequency and proprietary trading firms often buy and sell the same shares in large size within the day. Their deals usually net out and say little about long-term interest.
Why is a stock with huge delivery not on the list?
Often because one seller supplied most of the delivered shares in a block deal. If, without that seller’s shares, delivery is under 3× normal, the page treats the day as a block transfer, not a big-buyer day. JSW Cement on 6 Nov 2026 is an example.
When is the big-money footprint updated?
Every trading evening, after NSE publishes the day’s bhavcopy, F&O data and bulk and block deals.