
☰ All tutorials
Start here
Tool tutorialsHow to trade with ChartMineStocks
Stock monitorMy watchlistStock scores & checklistMarket & sectors
Nifty 50Bank NiftySensexFin NiftyDaily market reportMarket breadthSector rotationSector heatmapStock screenerRelative strength (RS)MCX commodity pricesFear & Greed IndexWhat happens after…Scanners
Top gainers & losersStocks to watch tomorrowNR7 stocks scannerInside bar stocks52-week high stocksGap up & gap down stocksRSI oversold stocksGolden cross stocksSuperTrend buy stocksScan builderEMA 9/21 crossoverMACD crossoverADX strong trendBollinger breakout / squeezeVolume spike stocksOpen = high / open = lowCandlestick pattern scannerNarrow CPR scannerF&O data
F&O ban listOI build-upOption chainPCR & max painExpiry calendarF&O lot sizesOI build-up heatmapPCR trendMax pain trendFutures basisStock screens
Quarterly growersProfit growth stocksLow P/E stocksMutual fund buyingNear 52-week low, growingDebt-free companiesHigh ROE & ROCEMagic Formula stocksLow price-to-bookSmart money
FII / DII dataShareholding changesBig-money footprintShort selling dataF&O positions by participantBulk & block dealsPromoter buyingDelivery percentageCalendars
Results calendarQuarterly results trackerBoard meetingsCorporate actionsIPO calendarIPO performanceResearch & planning
Strategy testerCompare stocksDividend yield stocksASM / GSM listExpiry-day movesSeasonality & stock historyNSE holidays 2026Position size calculatorOption payoff calculatorPivot point calculatorMore
Stock scanners hubStock screensHow to use the MCX commodity prices pages
A beginner’s tutorial on ChartMine’s MCX commodity prices hub and its gold, silver, crude oil, natural gas and metal pages: what an MCX futures price is, lot sizes and units, expiry and contract switches, trading hours, and real case studies from 2025-26.
What the MCX commodity prices pages are, in plain words
ChartMine’s MCX commodity prices hub shows the closing prices of the main commodities traded on the Multi Commodity Exchange of India (MCX): gold, silver, crude oil, natural gas, copper, aluminium, zinc, lead and nickel, plus the smaller Gold Mini and Silver Mini contracts. Each one also has its own page, for example MCX gold price, MCX silver price and MCX crude oil price.
These numbers are end of day, not live. A script saves each commodity’s daily open, high, low and close once a night, after the MCX session ends. On Saturday 14 November 2026 the hub showed the session of Friday 13 November 2026: gold ₹136,750 per 10 grams, silver ₹176,543 per kg, crude oil ₹8,372 per barrel and copper ₹1,308.55 per kg.
What you get:
- a hub with all 11 commodities: close, change, day range, 52-week range, 1-year change and the contract’s expiry;
- a page per commodity with the close, a chart (1M to 1Y), returns, the last 22 sessions, and contract details such as lot size and the value of one lot;
- plain explanations of why an MCX price is not the price at a jeweller or a dealer.
One line to remember: an MCX price is the price of a futures contract, measured at the close. It is a market benchmark, not the rate you pay in a shop and not a live quote.
MCX basics for beginners: futures, contracts, lots, ticks and expiry
If you have only traded shares, commodity prices can look strange at first. Here are the ideas you need, one by one.
| Idea | Plain meaning | Example from 13 Nov 2026 |
|---|---|---|
| Futures contract | An agreement to buy or sell a fixed quantity of a commodity at today’s price on a future date (the expiry). MCX trades futures, not physical goods over the counter. | GOLD26DECFUT: gold for December 2026 |
| Contract month and expiry | Each contract ends on a set day. After that it stops trading and is settled. | Gold Dec 2026 contract expires Fri 4 Dec 2026; Crude Oil Nov 2026 expires Thu 19 Nov 2026 |
| Near-month contract | The contract that expires soonest. ChartMine shows this one for every commodity. | For crude it is November; for gold it is already December |
| Quote unit | The quantity the price refers to. It is not the same as the lot. | Gold is quoted per 10 grams; silver per kg; crude per barrel |
| Lot size | The quantity in one contract. You trade whole lots only. | Gold: 1 kg; Crude Oil: 100 barrels |
| Value of one lot | Price × units per lot. This is the exposure you carry. | Gold lot ≈ ₹1.37 crore; crude lot ≈ ₹8.37 lakh |
| Tick | The smallest price step. | Gold ₹1 per 10 g; copper ₹0.05 per kg; natural gas ₹0.10 |
| Margin | The deposit your broker blocks to let you hold a lot. It is only a fraction of the lot value, which is why futures are leveraged. | Set by the exchange; check your broker |
Why the near-month changes
Not every commodity has a contract every month. In mid-November 2026, gold and silver showed December contracts because their nearest listed contract is December, while crude, natural gas, copper and the other base metals showed November. When the near-month contract expires, ChartMine’s series moves to the next one. The two contracts usually trade at different prices, so the first day after a switch can show a jump that is not a real move in the market (see the case studies).
Closing price vs settlement price
The close on ChartMine is the last traded price of the session from the broker data feed. MCX also publishes an official settlement price, used for daily profit and loss, which can differ by a few ticks. For learning and comparison, the difference is small.
The 11 MCX contracts on ChartMine: units, lot sizes and lot values
This table uses the contract details on each commodity page and the closes of 13 Nov 2026. Lot value = close × units per lot. Lot sizes come from MCX’s specifications and can change, so check mcxindia.com or your broker before trading.
| Commodity | Quoted in | Lot | Close 13 Nov 2026 | One lot ≈ | Expiry of contract shown |
|---|---|---|---|---|---|
| Gold | ₹ per 10 g | 1 kg | 136,750 | ₹1.37 crore | 4 Dec 2026 |
| Gold Mini | ₹ per 10 g | 100 g | 136,788 | ₹13.68 lakh | 4 Dec 2026 |
| Silver | ₹ per kg | 30 kg | 176,543 | ₹52.96 lakh | 4 Dec 2026 |
| Silver Mini | ₹ per kg | 5 kg | 178,490 | ₹8.92 lakh | 30 Nov 2026 |
| Crude Oil | ₹ per barrel | 100 barrels | 8,372 | ₹8.37 lakh | 19 Nov 2026 |
| Natural Gas | ₹ per mmBtu | 1,250 mmBtu | 307.90 | ₹3.85 lakh | 24 Nov 2026 |
| Copper | ₹ per kg | 2,500 kg | 1,308.55 | ₹32.71 lakh | 30 Nov 2026 |
| Aluminium | ₹ per kg | 5 tonnes | 327.25 | ₹16.36 lakh | 30 Nov 2026 |
| Zinc | ₹ per kg | 5 tonnes | 404.35 | ₹20.22 lakh | 30 Nov 2026 |
| Lead | ₹ per kg | 5 tonnes | 194.40 | ₹9.72 lakh | 30 Nov 2026 |
| Nickel | ₹ per kg | 1,500 kg | 1,496.60 | ₹22.45 lakh | 18 Nov 2026 |
Mmbtu means million British thermal units, the standard unit for natural gas. A barrel of crude oil is about 159 litres.
What one tick is worth
Tick × units per lot gives the rupee value of the smallest move. Gold: ₹1 per 10 g × 100 = ₹100 per lot. Crude: ₹1 × 100 barrels = ₹100. Copper: ₹0.05 × 2,500 kg = ₹125. Natural gas: ₹0.10 × 1,250 = ₹125. A normal day moves many ticks: on 13 Nov 2026 gold’s day range was 1,532 ticks wide (136,055 to 137,587), or about ₹1.53 lakh per lot from low to high.
Why MCX prices are useful, why they differ from shop rates, and their limits
A clean benchmark
One transparent exchange price for gold, silver, oil and metals, the same for everyone, recorded every session.
Context for stocks
Crude oil matters for oil marketers, paints and airlines; metals for metal stocks; gold for jewellers and gold-loan companies.
Risk awareness
The lot value on each page shows how large one contract really is before you think about trading it.
History in one place
About a year of daily data (from 10 Nov 2025, 263 sessions for gold on 13 Nov 2026) with a chart and returns.
Why MCX gold is not the jewellery rate
- It is a futures price. It includes the cost of carry (interest and storage) until expiry, so it usually sits a little above the spot price.
- Purity. MCX Gold is for 995 purity (99.5% pure) bars. Most jewellery is 22 carat, which is less pure, and is priced differently.
- Taxes and charges. Shops add 3% GST, making charges and their own margin. At ₹13,675 per gram (MCX close on 13 Nov 2026 ÷ 10), 3% GST alone adds about ₹410 per gram before any making charge.
- Timing. Shops set rates in the morning; the MCX close is from late night.
Silver works the same way: ₹176,543 per kg on 13 Nov 2026 is about ₹176.54 per gram before GST. For crude oil and metals, dealer prices add freight, taxes and margins.
Limits you should know
- Not live. During market hours, use your broker’s terminal.
- Near-month only. Prices jump when the series moves to a new contract.
- About one year of history. Ranges marked 52-week use ChartMine’s saved series since 10 Nov 2025.
- Last traded price, not settlement. Small differences from MCX’s official numbers are normal.
- Leverage. Commodity futures can lose more than the margin paid.
MCX trading hours, holidays and when the page updates
| Item | Detail |
|---|---|
| Session | 9:00 am to 11:30 pm IST in summer, and 9:00 am to 11:55 pm in winter. The longer winter session follows US daylight saving: when US clocks go back in early November, MCX closes later. The MCX symbol list dated 14 Nov 2026 shows the session as 09:00 to 23:55. |
| Morning and evening sessions | On some exchange holidays MCX opens only for the evening session (from 5:00 pm). On 10 Nov 2026 (Diwali Balipratipada) NSE and BSE were shut, but MCX’s evening session was open, so the gold page shows a row for Tue 10 Nov. |
| Fully closed days | On the weekdays 26 Jan, 3 Apr, 2 Oct and 25 Dec 2026 both MCX sessions are closed. The reverse also happens: on 1 Jan 2026 only the morning session was open. The NSE holidays 2026 page shows the commodity session for every holiday. |
| Coming up | Tue 24 Nov 2026 (Guru Nanak Jayanti): morning session closed, evening session open. |
| Special sessions | Diwali Muhurat trading on Sun 8 Nov 2026 included commodities; the gold page has a row for Sun 8 Nov. |
| ChartMine update | Once a night, a few minutes after the session ends. Next morning the hub shows the last finished session. |
Because MCX trades until late at night, it reacts to news from the US and Europe that comes after the Indian stock market has closed at 3:30 pm. A price you see in the evening can be very different from the stock market mood of the afternoon.
A tour of the hub and a commodity page
The hub: all commodities in one table
Open the MCX commodity prices hub. A grid of tiles shows each close and change; tap a tile to open that commodity. Below it, the main table groups the contracts into bullion, energy and base metals.
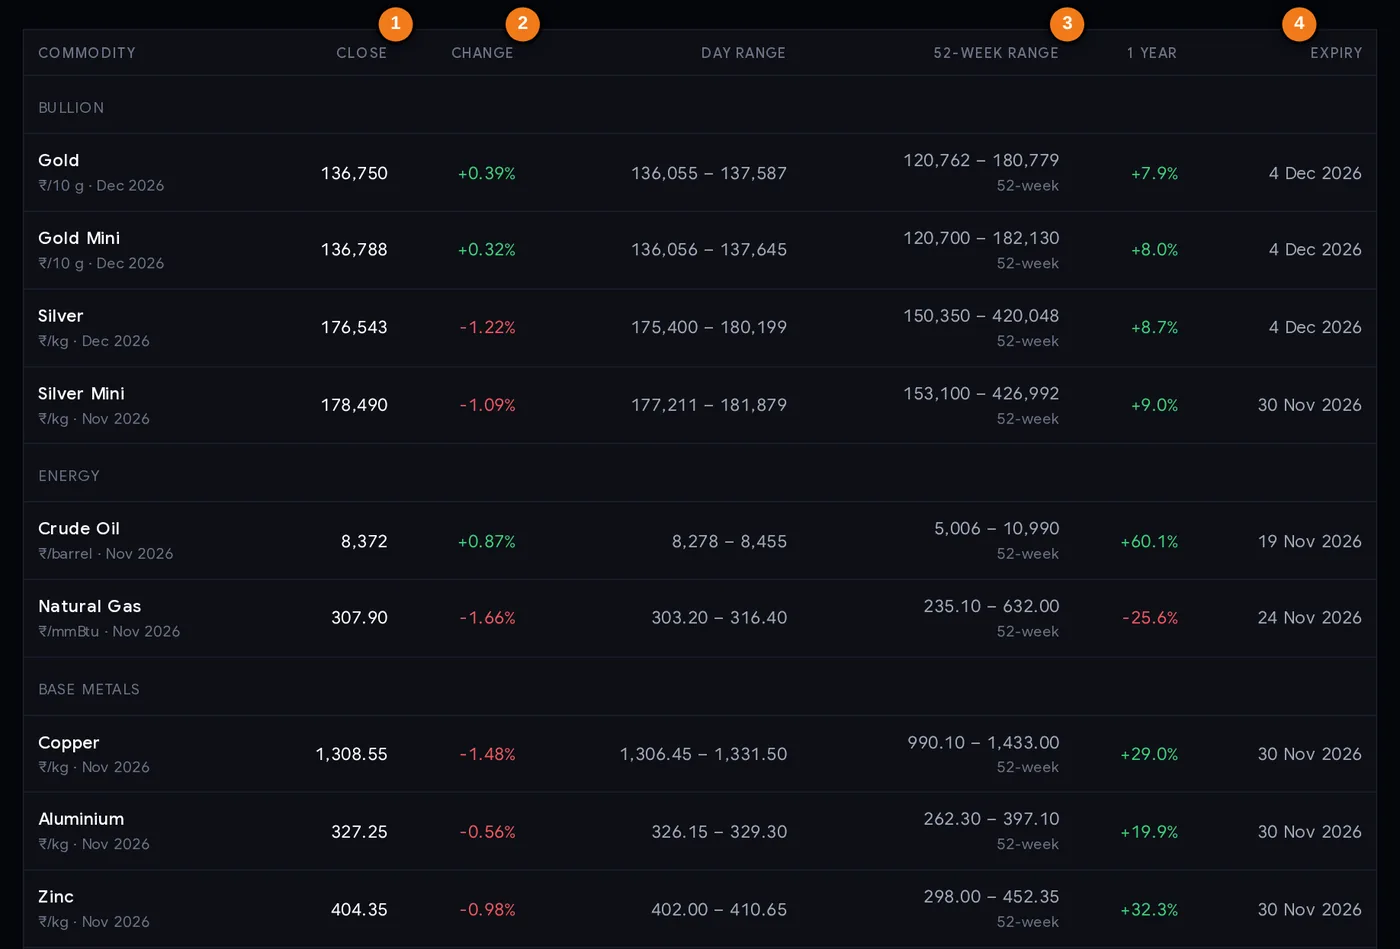
- 1Close: last traded price of the session
- 2Change from the previous close
- 352-week range on the saved near-month series
- 4Expiry date of the contract shown
| Column | Meaning |
|---|---|
| Commodity | Name, quote unit and contract month (for example ₹/10 g · Dec 2026) |
| Close | Last traded price of the session |
| Change | % change from the previous close; after a contract switch it compares two contracts |
| Day range | Low to high of the session |
| 52-week range | Lowest low to highest high on the saved near-month series |
| 1 year | % change over one year on the same series |
| Expiry | Expiry date of the contract shown |
A commodity page: the closing price block
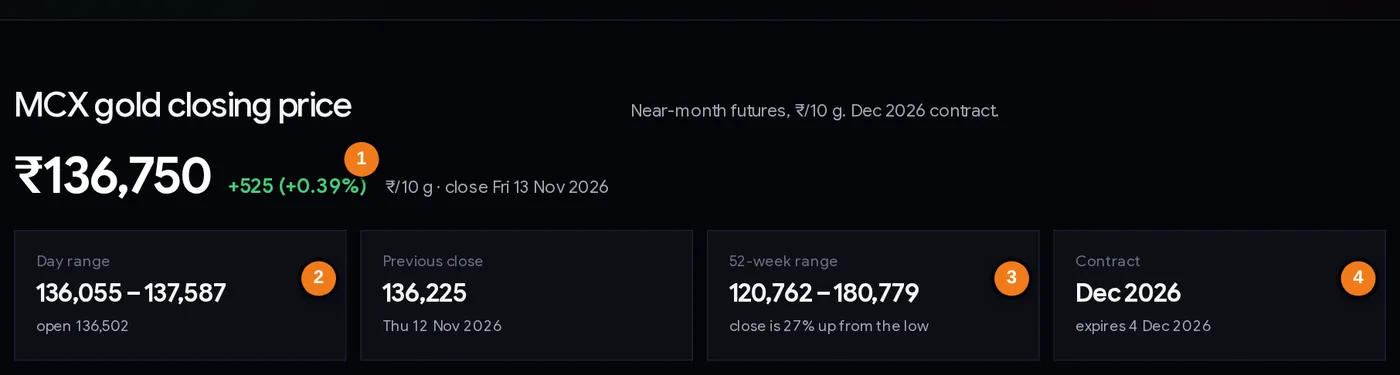
- 1Close with the change in rupees and per cent
- 2Day range and the open
- 352-week range and how far the close is above the low
- 4Contract month and its expiry date
The top block gives the close in large type with the change in rupees and per cent, then four boxes: day range (with the open), previous close, 52-week range with how far the close is above the low, and the contract month with its expiry. On 13 Nov 2026 gold’s close of ₹136,750 sat 27% of the way up from its 52-week low (₹120,762, 18 Nov 2025) to its high (₹180,779, 29 Jan 2026).
The chart and returns
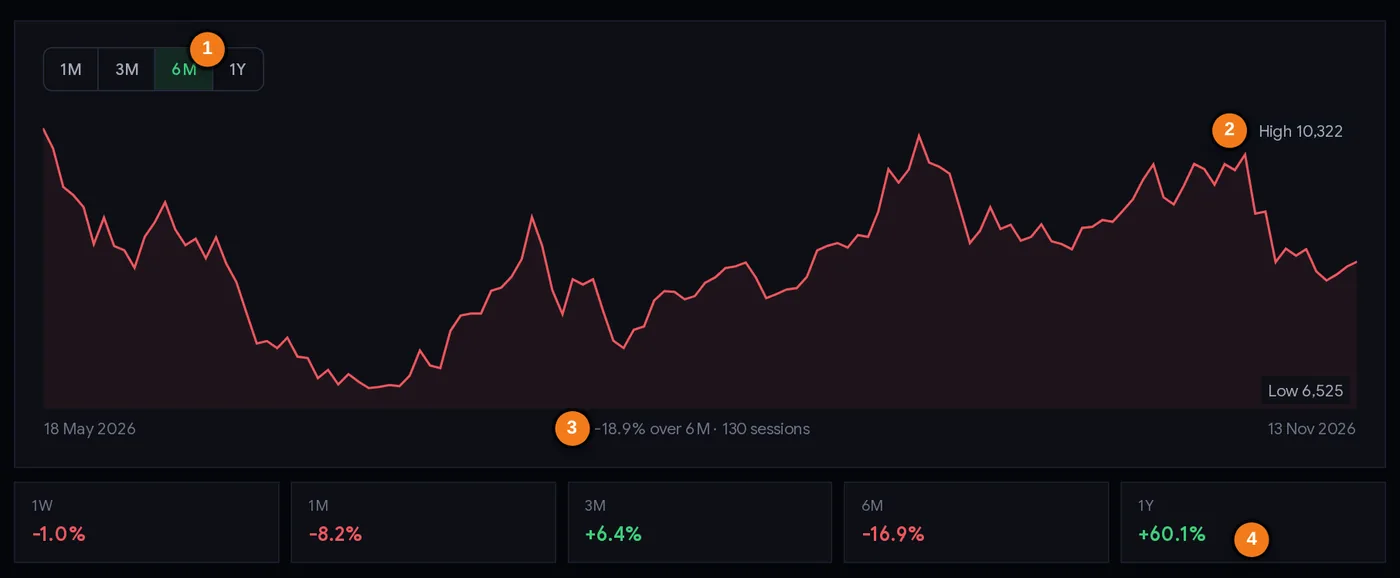
- 1Range buttons: 1M, 3M, 6M (default) and 1Y
- 2Highest and lowest close in the range
- 3Change over the range and number of sessions
- 41-year change on the near-month series
The chart is a line of daily closes. Buttons switch between 1M, 3M, 6M and 1Y; the labels show the highest and lowest close in that range, and the line under the chart gives the change over the range and the number of sessions. Below, five boxes show 1-week, 1-month, 3-month, 6-month and 1-year changes. On crude oil on 13 Nov 2026 they read −1.0%, −8.2%, +6.4%, −16.9% and +60.1%: a reminder that the answer depends entirely on the window you pick.
Last sessions and contract details
A table lists the open, high, low, close and change of the last 22 sessions, newest first. Then the contract box gives the facts you need before thinking about a trade:

- 1Lot size (1 kg for MCX Gold)
- 2Value of one lot at the latest close
- 3Expiry date of the contract shown
Quote unit, lot size, value of one lot at the close, the exact contract code, the expiry date and how much history is saved. The page ends with questions and answers and tiles for the other commodities.
Step-by-step: a 5-minute evening check of commodity prices
- Check the session date on the grey label. If you open the page before midnight, it may still show the previous session.
- Scan the hub table. Which commodities moved most? On 13 Nov 2026 crude gained the most (+0.87%) and nickel fell the most (−2.18%).
- Check the expiry column. Crude (19 Nov), nickel (18 Nov) and natural gas (24 Nov) were close to expiry. Expect the series to switch contract soon.
- Open the commodity you follow. Read the close in rupees and per cent, then see where it sits in the 52-week range.
- Switch the chart to 1Y, then 1M. Is the short move part of a bigger trend?
- Read the lot value. Ask: what does a 2% move cost on one lot? For gold at ₹1.37 crore per lot, 2% is about ₹2.7 lakh.
- Write one line in a journal, for example: “Gold ₹136,750, −6.2% in a month, Dec contract expires 4 Dec.”
These pages are for learning and context. They are not trading signals. If you trade commodity futures, decide your maximum loss first, use a stop loss, and size the position with the position size calculator.
How people use the pages: three playbooks
1. Gold buyer or saver: understand the benchmark
Someone planning a jewellery purchase uses the gold page to see the trend, not to get a shop price. The 1Y box (+7.9% on 13 Nov 2026) and the 6M box (−13.7%) together say gold rose over the year but fell from its January peak. The shop rate will still add GST, making charges and margin. Many savers buy in instalments rather than trying to pick the bottom.
2. Stock trader: read commodity moves as sector context
Crude oil, metals and gold affect listed companies. A trader who holds metal stocks glances at copper, aluminium and zinc each evening; one who follows oil-sensitive stocks checks crude. Combine this with the sector heatmap to see whether the related sector moved too. Remember that MCX trades till late night, so the commodity close comes many hours after the stock market close.
3. Beginner thinking about commodity futures: start with the numbers that hurt
Before any trade, write down three numbers from the page: the lot value, the tick value and the biggest recent daily move. For silver on 13 Nov 2026 the lot was worth about ₹52.96 lakh, and 44.5% of sessions in the saved year moved more than 2%. Start with the mini contracts if your broker offers them, and only with money you can afford to lose. Most people underestimate how fast leverage works against them.
Case studies from real data
All numbers come from ChartMine’s saved MCX near-month futures series (10 Nov 2025 to 13 Nov 2026). They describe what happened; they do not predict anything.
Case 1: the bullion crash of 30 January 2026
Gold and silver rose fast into late January 2026. On 29 Jan 2026 MCX silver touched ₹420,048 per kg intraday and closed at ₹399,893; gold touched ₹180,779 per 10 g and closed at ₹169,403. The next day, 30 Jan, silver closed at ₹291,925 (−27.0%) and gold at ₹149,653 (−11.66%). On one lot, that is about ₹32.4 lakh lost on silver (30 kg) and ₹19.75 lakh on gold (1 kg) in a single session. By 13 Nov 2026 silver was at ₹176,543, 58% below its January intraday high. Lesson: “safe” assets can fall faster than shares, and leverage turns a bad day into a disaster.
Case 2: a 42.66% “fall” in natural gas that was mostly a contract switch
On 27 Jan 2026 the near-month natural gas series closed at ₹597.8 after touching ₹632.0. On 28 Jan it closed at ₹342.8, a change of −42.66%. On ChartMine’s saved data, volume jumped from 21,532 to 183,735 contracts that day, which points to the series moving from the expiring January contract to the much cheaper February one. The page itself warns that a change on the day after an expiry compares two different contracts. Lesson: check the contract month before believing a giant one-day move.
Case 3: crude oil doubled, then swung wildly
MCX crude’s 52-week low was ₹5,006 per barrel (16 Dec 2025) and its high ₹10,990 (7 Apr 2026). On 8 Apr 2026 it closed at ₹8,861, −16.95% in a day: about ₹1.81 lakh per 100-barrel lot. In early November 2026 it fell 8.70% on 2 Nov and 8.13% on 4 Nov. In the saved year, 49.8% of sessions moved more than 2%. On 13 Nov 2026 it closed at ₹8,372, still +60.1% over one year. Lesson: a big 1-year gain says nothing about the risk inside the year.
Case 4: the gold-silver ratio
The gold-silver ratio is how many kg of silver one kg of gold buys (gold per 10 g × 100 ÷ silver per kg). On the MCX closes it was 80.7 on 10 Nov 2025, fell to 42.4 on 29 Jan 2026 as silver raced ahead, and was back at 77.5 on 13 Nov 2026. Traders watch it to compare the two metals. It is a description of relative price, not a timing tool.
Common mistakes
- Comparing the MCX gold price with a jeweller’s board. Different purity, GST, making charges, timing and carry. Use MCX as a benchmark only.
- Mixing up the quote unit and the lot. Gold is quoted per 10 g but one lot is 1 kg: 100 times the quoted price.
- Ignoring contract switches. Big changes on the day after an expiry can be a roll, not a crash (natural gas, 28 Jan 2026).
- Treating the page as live. It shows the last finished session; MCX keeps trading until 11:30 pm or 11:55 pm.
- Holding the near-month into expiry by accident. Check the expiry date on the page; some contracts can end in physical delivery obligations. Ask your broker.
- Sizing by margin, not by lot value. The margin may look small, but the loss is calculated on the full lot.
- Assuming gold and silver only go up. Silver fell 27.0% in one day on 30 Jan 2026.
Checklist before you use MCX prices in a decision
- I checked the session date and know the price is not live.
- I know the quote unit and the lot size of this commodity.
- I worked out the value of one lot and the rupee cost of a 2% move.
- I checked the contract month and expiry date, and whether a switch happened recently.
- I looked at the chart on 1M and 1Y and at the 52-week range.
- I am not comparing the MCX price with a retail rate as if they were the same thing.
- If I trade, my stop loss and position size are decided before entry, and I can afford the loss.
Glossary
| Term | Meaning |
|---|---|
| MCX | Multi Commodity Exchange of India, the main Indian commodity derivatives exchange. |
| Futures | A contract to buy or sell a set quantity at an agreed price on a future date. |
| Near-month contract | The contract with the nearest expiry. |
| Expiry | The last trading day of a contract. |
| Rollover / contract switch | Moving from the expiring contract to the next month. |
| Lot size | The quantity in one contract (for example 1 kg of gold). |
| Tick | The smallest price step. |
| Margin | The deposit needed to hold a futures position. |
| Leverage | Controlling a large value with a small deposit; gains and losses are magnified. |
| Spot price | The price for immediate delivery. |
| Cost of carry | Interest and storage costs that make futures usually trade above spot. |
| Settlement price | MCX’s official daily price used for profit and loss. |
| Bullion | Gold and silver. |
| Base metals | Copper, aluminium, zinc, lead and nickel. |
| mmBtu | Million British thermal units, the unit for natural gas. |
| Gold-silver ratio | How many units of silver one unit of gold buys. |
Questions
Are MCX prices on ChartMine live?
No. They are end-of-day closing prices of the near-month futures, saved once a night after the MCX session ends at 11:30 pm or 11:55 pm IST. For live prices during market hours use your broker’s terminal.
Why is the MCX gold price different from the jewellery shop rate?
MCX gold is a futures price for 995-purity gold, quoted per 10 grams, including cost of carry until expiry. Shops add 3% GST, making charges and margin, and most jewellery is 22 carat. Use MCX as a benchmark, not a buying price.
What are MCX trading hours?
Most MCX commodities trade from 9:00 am to 11:30 pm IST in summer and to 11:55 pm in winter, following US daylight saving. On some holidays only the evening session opens, as on 10 November 2026.
What is the lot size of MCX gold and crude oil?
MCX Gold is 1 kg per lot (quoted per 10 g), so one lot at ₹136,750 was worth about ₹1.37 crore on 13 November 2026. Crude Oil is 100 barrels per lot, about ₹8.37 lakh at ₹8,372. Check MCX for current specifications.
What does near-month contract mean?
It is the futures contract that expires soonest. ChartMine shows it for each commodity and moves to the next month after expiry, so the first day after a switch can show a jump that compares two different contracts.
How do I convert MCX gold price to price per gram?
Divide by 10, because MCX gold is quoted per 10 grams. The close of ₹136,750 on 13 November 2026 is about ₹13,675 per gram, before GST and making charges.
Is commodity trading on MCX safe for beginners?
Commodity futures are leveraged and can lose more than the margin paid; silver fell 27.0% in one day on 30 January 2026. ChartMine is not a SEBI-registered adviser. Learn the lot value first and always use a stop loss.