
☰ All tutorials
Start here
Tool tutorialsHow to trade with ChartMineStocks
Stock monitorMy watchlistStock scores & checklistMarket & sectors
Nifty 50Bank NiftySensexFin NiftyDaily market reportMarket breadthSector rotationSector heatmapStock screenerRelative strength (RS)MCX commodity pricesFear & Greed IndexWhat happens after…Scanners
Top gainers & losersStocks to watch tomorrowNR7 stocks scannerInside bar stocks52-week high stocksGap up & gap down stocksRSI oversold stocksGolden cross stocksSuperTrend buy stocksScan builderEMA 9/21 crossoverMACD crossoverADX strong trendBollinger breakout / squeezeVolume spike stocksOpen = high / open = lowCandlestick pattern scannerNarrow CPR scannerF&O data
F&O ban listOI build-upOption chainPCR & max painExpiry calendarF&O lot sizesOI build-up heatmapPCR trendMax pain trendFutures basisStock screens
Quarterly growersProfit growth stocksLow P/E stocksMutual fund buyingNear 52-week low, growingDebt-free companiesHigh ROE & ROCEMagic Formula stocksLow price-to-bookSmart money
FII / DII dataShareholding changesBig-money footprintShort selling dataF&O positions by participantBulk & block dealsPromoter buyingDelivery percentageCalendars
Results calendarQuarterly results trackerBoard meetingsCorporate actionsIPO calendarIPO performanceResearch & planning
Strategy testerCompare stocksDividend yield stocksASM / GSM listExpiry-day movesSeasonality & stock historyNSE holidays 2026Position size calculatorOption payoff calculatorPivot point calculatorMore
Stock scanners hubStock screensHow to use the event study (What happens after…)
A complete, plain-language guide to ChartMine’s event study: how each of the 11 events is defined, what two years of NSE data show against an ordinary day, the biases to watch for, a step-by-step way to test an idea, and real single-stock case studies.
What the event study is, in plain words
Every day you hear claims like “stocks that gap up keep running”, “buy the 52-week high breakout” or “NR7 means a big move is coming”. Most of these are repeated without anyone checking. The What happens after… page checks them.
It takes 11 common chart events (gap-ups, gap-downs, new 52-week highs and lows, NR7, inside bars, big-buyer days, volume spikes, 5% up and down days, three down days in a row), finds every time each one happened across 1,421 actively traded NSE stocks over the last two years, and measures what the stock did over the next 1, 5 and 20 sessions. Then it puts that next to what stocks did after an ordinary day, so you can see whether the event made any difference.
This is called an event study: a standard research method in finance. Instead of looking at one or two memorable examples (which is how most trading myths start), it looks at thousands of cases and reports the averages and the spread.
One line to remember: the page tells you how stocks behaved on average after an event in the past. It does not tell you what one stock will do next, and averages hide a very wide range of outcomes.
The 11 events and how each is defined
| Event | Exact rule used |
|---|---|
| Gap up 2%+ | Opened at least 2% above the previous close. |
| Gap down 2%+ | Opened at least 2% below the previous close. |
| New 52-week high | Closed above its highest close of the previous 250 sessions. |
| New 52-week low | Closed below its lowest close of the previous 250 sessions. |
| NR7 | The day’s high-low range was the narrowest of the last 7 sessions. |
| Inside bar | The day’s high and low were both inside the previous day’s range. |
| Big-buyer day | Delivered shares at least 3× the stock’s normal (median of the previous 50 sessions), with a normal-or-higher delivery % and turnover of at least ₹0.5 crore. |
| Volume 3× on an up day | Volume at least 3× its 20-day average, and the stock closed higher. |
| Up 5%+ in a day | Closed at least 5% higher than the previous close. |
| Down 5%+ in a day | Closed at least 5% lower. |
| 3 down days in a row | Closed lower three sessions running. |
How “what happened next” is measured
- Next session, 5 sessions later, 20 sessions later: the % change from the event day’s close to the close 1, 5 or 20 trading days later. Twenty sessions is about one month.
- % higher: the share of cases in which the stock was above the event-day close at that point.
- Average and median: the average is pulled up or down by a few huge moves; the median (middle case) shows the typical outcome. When they differ a lot, a few big winners or losers are driving the average.
- Any day: the same measures for ordinary days (a sample of every third trading day for every stock). This is the yardstick. An event is only interesting if it beats “any day”.
Prices are adjusted for splits and bonuses. Results are before brokerage, taxes and slippage.
What two years of NSE data show
Here is the full picture as shown on the page on 6 Nov 2026 (cases over the last two years across 1,421 stocks).
| Event | Cases | Higher next session | Higher after 5 | Higher after 20 | 20-session average | 20-session median |
|---|---|---|---|---|---|---|
| Any day (yardstick) | – | 45% | 44% | 44% | +0.18% | −1.49% |
| Gap up 2%+ | 9,791 | 52% | 59% | 58% | +4.75% | +2.57% |
| Gap down 2%+ | 5,870 | 54% | 49% | 52% | +2.84% | +0.72% |
| New 52-week high | 7,883 | 46% | 47% | 47% | +0.40% | −0.72% |
| New 52-week low | 10,407 | 48% | 46% | 53% | +3.02% | +0.82% |
| NR7 | 42,708 | 45% | 44% | 43% | −0.03% | −1.66% |
| Inside bar | 44,791 | 45% | 43% | 43% | −0.05% | −1.73% |
| Big-buyer day | 16,381 | 47% | 48% | 47% | +1.43% | −0.66% |
| Volume 3× on an up day | 9,582 | 44% | 42% | 41% | −0.30% | −2.37% |
| Up 5%+ in a day | 9,714 | 48% | 50% | 50% | +2.63% | +0.09% |
| Down 5%+ in a day | 5,055 | 55% | 54% | 58% | +5.59% | +2.92% |
| 3 down days in a row | 39,658 | 48% | 46% | 43% | −0.09% | −1.59% |
What stands out, in plain words
- The yardstick was weak. After an ordinary day the typical stock was lower a month later (median −1.49%, only 44% higher). These two years were hard for the average NSE stock. Every event must be read against that.
- NR7 and inside bars made no difference. With over 40,000 cases each, their results are almost identical to any day. On their own, these “coiled spring” patterns did not predict direction.
- 52-week highs were only slightly better than any day (47% vs 44% higher after 20 sessions). “Buy every new high” was not a strong rule in this period.
- Volume spikes on up days were slightly worse than any day (41% higher after 20 sessions).
- Gap-ups and big down days looked best, but these are exactly the events most affected by the bias explained next.
Why use it: advantages and limits
✅ Tests the folklore
Thousands of real cases instead of a few memorable charts.
✅ Always against a yardstick
Every result sits next to “any day”, so you see the difference the event made, not just the raw number.
✅ Shows the spread
The histogram shows how widely outcomes vary, which matters more for risk than the average.
✅ Today’s list
Each event lists the stocks that had it on the latest day, so you can study live examples.
The limits (please read this part)
- Survivorship bias. The study uses stocks that are actively traded today. Companies that collapsed, were delisted or became illiquid over the two years are missing. Stocks that did well are more likely to still be on the list, which flatters past results, especially for events like big down days, gap-downs and 52-week lows (the ones that recovered are in the data; the ones that kept falling until they dropped out are not).
- Averages hide huge spreads. After gap-ups, 16.8% of cases were up 18% or more 20 sessions later, and 3.7% were down 18% or more. One trade can land anywhere.
- Overlapping cases. A stock that gaps up three days in a row counts three times, and many stocks move together on market-wide days. The real number of independent cases is much smaller than the counts suggest.
- Two years only, before costs. A different market regime can change the results. Brokerage, taxes and slippage reduce real returns, most for short holding periods.
- Close-to-close. The returns start at the event day’s close. You usually learn about a gap-up or a 5% day only once it has happened, so this is the realistic starting point, but your fill can differ.
So how should you use it? To check a belief before you build a strategy on it, and to understand the range of outcomes. The page itself says it plainly: this is not a trading strategy. Treat any edge you see as a starting hypothesis for your own testing in the strategy tester, with stop losses.
A tour of the page
Open What happens after…. At the top is a row of buttons, one per event. Each button opens a panel with three cards.
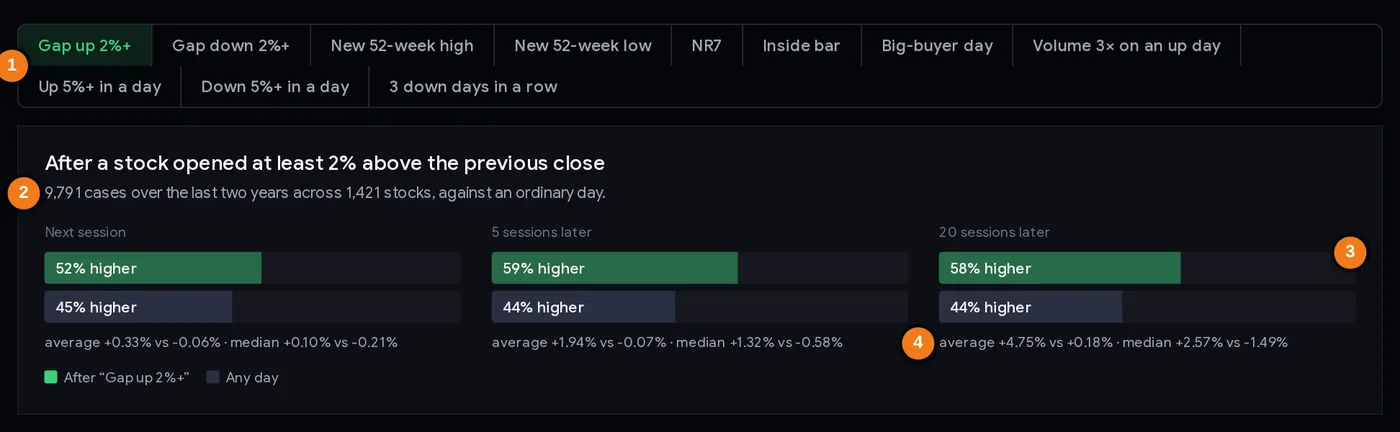
- 1Event buttons: one panel per event
- 2How many cases stand behind the numbers
- 3% of cases higher: after the event (green) vs any day (grey)
- 4Average and median, event vs any day
Card 1: the comparison bars
For each horizon (next session, 5 sessions, 20 sessions) you see two bars: green for “after the event” and dark grey for “any day”. The bar length is the % of cases that ended higher. Under the bars, the small line gives the average and median for both, for example “average +4.75% vs +0.18% · median +2.57% vs −1.49%” for gap-ups after 20 sessions. Above the bars, the case count tells you how much data stands behind the numbers.
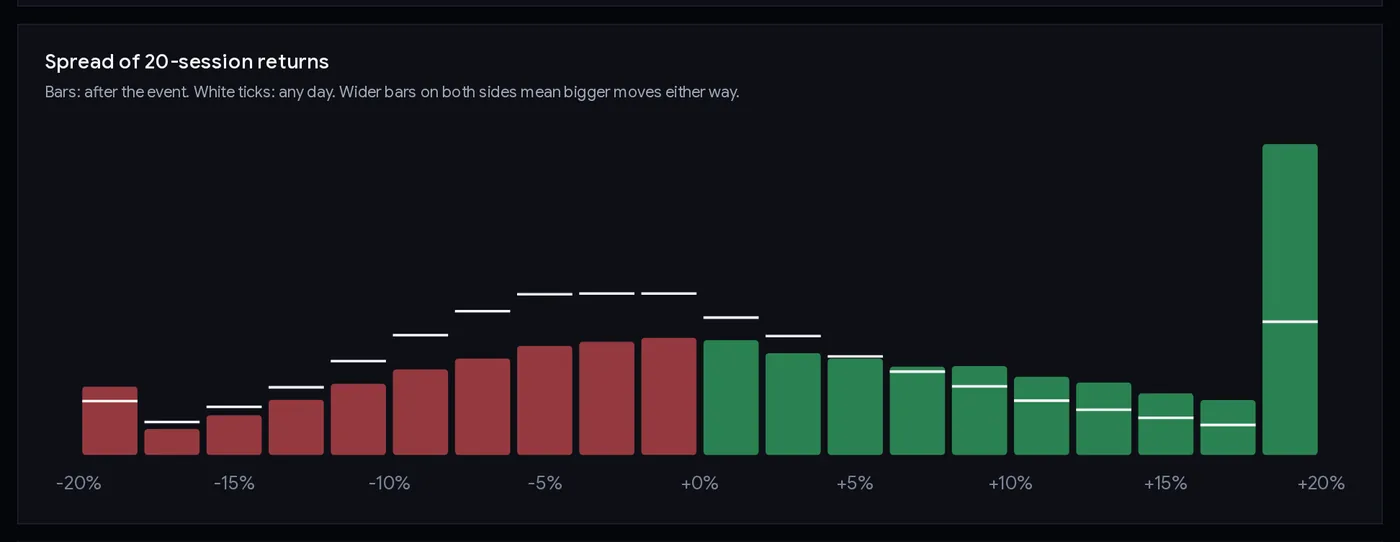
Card 2: the spread of 20-session returns
Each bar is a 2-point slice of outcomes from −20% to +20% (the end bars also collect everything beyond ±18%). Coloured bars show how often the stock landed in that slice after the event; the white ticks show the same for any day. Hover or tap a bar to read the exact percentages. Wider bars on both sides mean bigger moves either way: more opportunity and more risk.
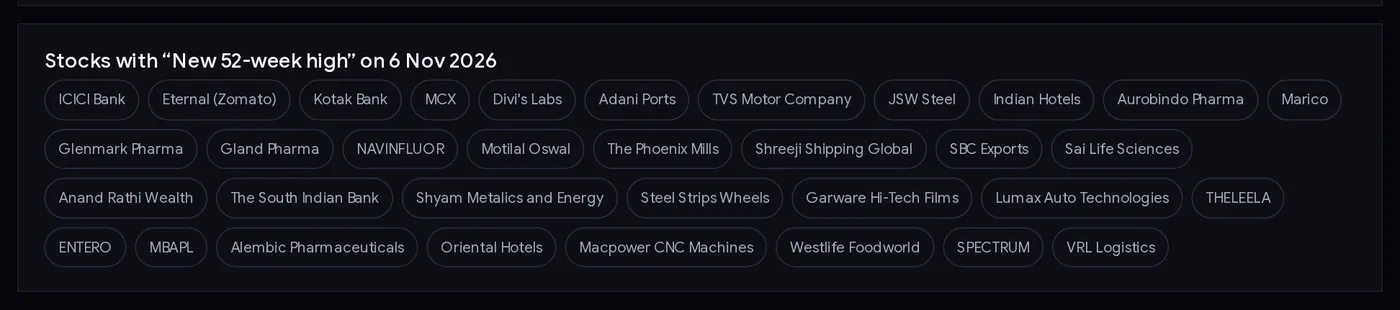
Card 3: stocks with this event today
The last card lists the stocks that had the event on the latest trading day, most traded first (up to 40, then “and N more”). Click any name for its stock page. On 6 Nov 2026 the gap-up list included Bharti Airtel, Mahindra & Mahindra and MphasiS; the 52-week-high list included ICICI Bank, Kotak Bank and Divi’s Labs.
Step by step: checking a trading idea
- Write the idea as a sentence. For example: “After a stock closes at a new 52-week high, it keeps rising for a month.”
- Open the matching tab (New 52-week high).
- Compare with any day, not with zero. 47% higher after 20 sessions sounds poor, but any day was 44%. The event added about 3 points.
- Look at the median as well as the average. If the average is positive but the median is negative (as for 52-week highs: +0.40% vs −0.72%), a few big winners are doing the work, and the typical trade lost.
- Check the spread chart. How often did the stock fall 10% or more? That is the risk your stop loss must handle.
- Think about bias. Could survivorship explain the result? Events after big falls are the most exposed.
- Decide what to add. An event alone rarely carries an edge. Traders combine it with trend, sector, volume or results; test that combination before risking money.
- Look at today’s list and study two or three charts to see what the event looks like in practice.
Three ways to use the results
Playbook A: drop the rules that do not work
If your system buys every NR7 or inside bar on its own, the data says that alone added nothing over 40,000+ cases. That does not make the pattern useless (traders use it to find a tight stop or a breakout level), but it means the edge, if any, must come from what you combine with it. This saves you from building on sand.
Playbook B: set realistic expectations and stops
Use the spread chart to size your stop. After a 52-week high, a 20-session move of −6% or worse happened in about 29% of cases (add up the slices below −6%), roughly three trades in ten. If your stop is 3% away, expect it to be hit often; if you cannot accept that, size smaller. The position size calculator turns your stop distance into a quantity.
Playbook C: treat bounces with care
Big down days and gap-downs show the best-looking averages, which tempts people to “buy the crash”. Remember the survivorship warning, check why the stock fell (results, fraud, sector news) on its stock page, and never buy a falling stock without a predefined exit. Case 4 below shows a 5% down day that kept falling.
Case studies: single stocks behind the averages
The averages are made of individual trades like these. Prices are NSE closes in ₹, adjusted for splits and bonuses; returns are from the event day’s close.
1. SBI, 9 Feb 2026: three events in one day
SBI opened 5.03% above the previous close (gap up), closed 7.46% higher at 1,146.00 (up 5%+), and had a big-buyer day (2.19 crore shares delivered, 4.6× normal). Next session: −0.17%. Five sessions later: +5.42% (1,208.10). Twenty sessions later: −2.95% (1,112.20). The trade looked brilliant after a week and was a loss after a month. Lesson: the horizon you choose changes the answer; decide your exit plan before entering.
2. Solar Industries, 13 Aug 2026: up 8.5%, then a dip, then more
It closed 8.51% higher at 20,324. Next session −1.75%; five sessions later −2.78%; twenty sessions later +10.07% (22,370). Lesson: even a move that worked over a month went against the buyer first. A stop placed too tight would have taken the trader out before the gain.
3. Federal Bank, 17 Jul 2026: a big day that went nowhere
It closed 6.86% higher at 349.00. One, five and twenty sessions later it was +0.50%, +1.52% and +0.66%. Lesson: most cases are neither disasters nor home runs. The middle of the histogram is where most trades land.
4. SBI, 8 May 2026 and Oil India, 10 Jun 2026: the “bounce” that did not come
“Down 5%+” has the best-looking 20-session average on the page (+5.59%). But SBI fell 6.66% on 8 May 2026 to 1,019.30, fell another 4.48% the next session and was still 3.66% lower twenty sessions later. Oil India fell 10.21% on 10 Jun 2026 to 427.35 and was 1.01% lower twenty sessions later. Lesson: an average built from thousands of cases (and flattered by survivorship) says little about the next case. Buying after a crash needs a reason and a stop.
Common mistakes
- Comparing with zero instead of “any day”. In these two years, any day had only 44% of stocks higher after a month.
- Reading only the average. Case: 52-week highs had a positive average but a negative median.
- Ignoring survivorship bias. It inflates bounce-type results most.
- Treating a 3-point difference as a strategy. Small edges disappear after costs and in other periods.
- Forgetting the path. Case 2: +10% after a month, −2.8% after a week.
- Using today’s list as a buy list. It is a list of examples to study.
Checklist before trusting an event
- The event’s rule matches what you actually trade.
- Compared with “any day” at every horizon.
- Average and median both checked.
- Spread chart checked: how often a 10% loss happened.
- Survivorship bias considered (especially for falls, gaps down, 52-week lows).
- Costs considered for short holding periods.
- Combination with other filters tested before real money.
- Every trade has a stop loss and a position size.
Glossary
| Event study | Measuring what happens after a specific event across many past cases. |
| Session | One trading day. |
| Gap | An open far from the previous close. |
| NR7 | Narrowest high-low range of the last 7 sessions. |
| Inside bar | A day whose range sits inside the previous day’s range. |
| Big-buyer day | Delivered shares 3× normal or more, with normal-or-higher delivery %. |
| Median | The middle outcome; half above, half below. |
| Yardstick (any day) | What stocks did after ordinary days, for comparison. |
| Survivorship bias | Studying only companies that still exist, which flatters the past. |
| Histogram | A bar chart of how often outcomes fall in each range. |
Questions
What happens after a stock gaps up?
Across 9,791 gap-ups of 2% or more on NSE in the last two years, the stock was higher 20 sessions later 58% of the time (average +4.75%), against 44% for any day. The study uses stocks traded today, which flatters past results, and outcomes varied widely.
Do 52-week high stocks keep going up?
Only slightly more often than usual in our data: after 7,883 new 52-week closing highs, stocks were higher 20 sessions later 47% of the time (average +0.40%, median −0.72%), against 44% for any day.
Does NR7 predict a big move or direction?
Not on its own in our data. After 42,708 NR7 days, results over 1, 5 and 20 sessions were almost identical to any ordinary day.
Should I buy stocks after a 5% fall?
The average looks good (+5.59% after 20 sessions, 58% higher), but it is flattered by survivorship bias and hides cases like SBI on 8 May 2026, which fell 4.48% more the next day. It is not a strategy on its own; ChartMine does not give buy or sell advice.
Is the event study a trading strategy?
No. These are averages over thousands of past cases, before costs, with a wide spread of outcomes. They show how markets behaved, not what will happen next.
How many years of data does the event study use?
About two years of daily NSE data for the 1,421 most traded stocks, measured over the next 1, 5 and 20 sessions.
Why is the any-day baseline negative?
Because the typical NSE stock fell over the period studied: after an ordinary day, the median stock was 1.49% lower 20 sessions later. Every event should be compared with this, not with zero.