
☰ All tutorials
Start here
Tool tutorialsHow to trade with ChartMineStocks
Stock monitorMy watchlistStock scores & checklistMarket & sectors
Nifty 50Bank NiftySensexFin NiftyDaily market reportMarket breadthSector rotationSector heatmapStock screenerRelative strength (RS)MCX commodity pricesFear & Greed IndexWhat happens after…Scanners
Top gainers & losersStocks to watch tomorrowNR7 stocks scannerInside bar stocks52-week high stocksGap up & gap down stocksRSI oversold stocksGolden cross stocksSuperTrend buy stocksScan builderEMA 9/21 crossoverMACD crossoverADX strong trendBollinger breakout / squeezeVolume spike stocksOpen = high / open = lowCandlestick pattern scannerNarrow CPR scannerF&O data
F&O ban listOI build-upOption chainPCR & max painExpiry calendarF&O lot sizesOI build-up heatmapPCR trendMax pain trendFutures basisStock screens
Quarterly growersProfit growth stocksLow P/E stocksMutual fund buyingNear 52-week low, growingDebt-free companiesHigh ROE & ROCEMagic Formula stocksLow price-to-bookSmart money
FII / DII dataShareholding changesBig-money footprintShort selling dataF&O positions by participantBulk & block dealsPromoter buyingDelivery percentageCalendars
Results calendarQuarterly results trackerBoard meetingsCorporate actionsIPO calendarIPO performanceResearch & planning
Strategy testerCompare stocksDividend yield stocksASM / GSM listExpiry-day movesSeasonality & stock historyNSE holidays 2026Position size calculatorOption payoff calculatorPivot point calculatorMore
Stock scanners hubStock screensHow to use the ASM / GSM list
A plain-language guide to NSE’s surveillance lists: what ASM and GSM are, what each stage changes for traders, why some stages show odd Roman numerals, how to read the page, and real case studies from October and November 2026.
What ASM and GSM are, in plain words
Stock exchanges watch every share for unusual behaviour. When a stock’s price swings wildly, or a handful of traders account for most of its volume, NSE and SEBI can put it under a surveillance measure: a set of extra trading rules meant to cool things down and warn investors to be careful.
The two you will hear about most are:
- ASM, Additional Surveillance Measure. For stocks with unusual price movement and volatility, measured with objective numbers: high-low and close-to-close price variation, concentration of trading among the top clients, volume jumps, delivery %, number of unique traders, market capitalisation and P/E. It has a short-term and a long-term version.
- GSM, Graded Surveillance Measure. For stocks whose share price does not seem to be backed by the company’s financial strength or fundamentals. Its restrictions are stricter and step up through stages.
One line to remember: a surveillance list is a caution flag, not an accusation. NSE’s own FAQ says shortlisting under ASM “should not be construed as an adverse action” against the company. What it does change is how you can trade the stock: higher margins, tighter price limits and, in later stages, settlement trade by trade.
The ASM / GSM list on ChartMine shows every stock currently under these measures, its stage, the day we first saw it in that list, what changed since the previous list, and how the price moved over one month and one year. On 9 Nov 2026 it showed 129 stocks under long-term ASM, 48 under short-term ASM and 76 under GSM, with 7 additions and 19 exits since the previous list.
The stages, and what each one means for a trader
The rules below are from NSE’s ASM FAQ (version 1.2, August 2026, which still reflects the frameworks as revised in September 2024). The exchange changes details from time to time, so always check the latest NSE circular before you trade a stock under surveillance.
Short-term ASM (ST-ASM)
For sharp moves over days or weeks, for example a close-to-close move of about ±25% in 5 trading days or ±40% in 15 days (plus an allowance for the market’s own move), together with heavy concentration among the top 25 clients. The ± matters: big falls qualify as well as big rises.
| Stage | Main action | What it means for you |
|---|---|---|
| Stage I | Margin of 50% or the existing margin, whichever is higher. NSE also asks the company whether there is any news it has not disclosed. | Leveraged positions need more money up front; many brokers cut intraday leverage. |
| Stage II | Margin of 100% (or existing, if higher). | Effectively no leverage: you pay the full value. |
A stock stays in each stage for at least 5 or 15 trading days, depending on which rule caught it, and leaves when it stops meeting the criteria on review.
Long-term ASM (LT-ASM)
For large moves over months, such as a high-low variation of more than 150% in 3 months or a close-to-close rise of more than 100% in 60 trading days (again adjusted for the market), combined with concentration among the top 25 clients and a minimum market capitalisation.
| Stage | Main action | What it means for you |
|---|---|---|
| Stage I | 100% margin. | No leverage on the stock. |
| Stage II | Price band cut to the next lower level; 100% margin. | The stock can move less in a day before hitting its limit. |
| Stage III | Price band cut again; 100% margin. | Daily moves are capped even more tightly. |
| Stage IV | Gross settlement (trade for trade) with 100% margin and a 5% price band. | Every trade must be settled by delivery; you cannot buy and sell the same day to square off. |
Stocks spend at least 90 calendar days in long-term ASM, are reviewed weekly, and step down one stage at a time when they stop meeting the criteria. For F&O stocks, later stages also cut the market-wide position limit, and at Stage IV no fresh derivative contracts are issued.
GSM
GSM runs from Stage 0 (shortlisted) up to Stage VI. The restrictions build step by step: trade-for-trade settlement, a price band of 5% or lower, 100% margin, then an additional surveillance deposit held by the exchange, and at the top stages trading allowed only on limited days. Brokers often block new buying from Stage II onwards. Because the exact stage table is revised by NSE, check the current GSM page on NSE’s website for a specific stock.
Why some GSM stocks show “Stage LXII” or “Stage XXXVI”
The page shows NSE’s own stage field. For GSM, NSE uses surveillance indicator numbers that combine several measures, and the page prints them as Roman numerals. They are not stage 62 or stage 36:
| Shown as | NSE code | Meaning (9 Nov 2026 file) | Stocks |
|---|---|---|---|
| Stage 0 | 99 | Shortlisted under GSM | 39 |
| Stage LXII | 62 | Insolvency (IBC) disclosure or recommenced scrip, plus GSM Stage 0 | 21 |
| Stage XXXVI / XXXVII | 36 / 37 | ESM Stage I or II, plus GSM Stage 0 | 3 / 2 |
| Stage I, III, VI | 1, 3, 6 | Plain GSM stages | 3, 1, 3 |
ESM (Enhanced Surveillance Measure) is a separate framework for smaller companies. IBC means the company is in, or has come out of, insolvency proceedings: a much more serious flag than a price spike.
Why traders watch the list: advantages and limits
✅ Avoid nasty surprises
Finding out that your stock moved to 100% margin or trade-for-trade after you placed an intraday trade is expensive. Check first.
✅ A map of the market’s hot spots
Short-term ASM additions are, by definition, the stocks that just moved most violently with concentrated trading.
✅ A red flag for investors
A GSM or IBC tag says the price may be detached from the business, or the business is in distress. Read the filings before going near it.
✅ What changed, daily
The page compares each list with the previous one: new names, exits, and the date each stock first appeared.
The limits
- It is not a buy or sell signal. In our sample, stocks added to short-term ASM went on to rise about as often as they fell (case study 4).
- Short history. ChartMine has tracked the lists daily only since 20 Oct 2026, so “Since” cannot be earlier than that, even if the stock has been under surveillance for months.
- Rules change. NSE revises the criteria and actions; the stage descriptions above are a guide, not the rulebook.
- Broker rules differ. Many brokers add their own limits on top of the exchange’s, such as blocking intraday or new buys.
- Many stocks are tiny. Plenty of names on the list are very small, thinly traded companies, and some have no price history on ChartMine (blank 1-month or 1-year cells).
A tour of the page
Open the ASM / GSM list. At the top are four counts; below them the full table with filters; then the stocks that left surveillance since the last list.
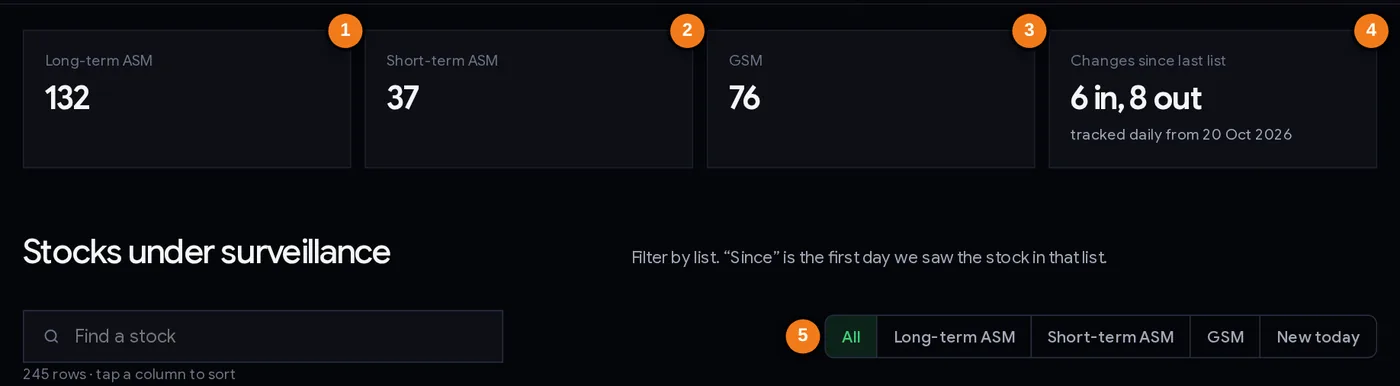
- 1Stocks under long-term ASM
- 2Stocks under short-term ASM
- 3Stocks under GSM
- 4Additions and exits since the previous list
- 5Filters: All, one list at a time, or New today
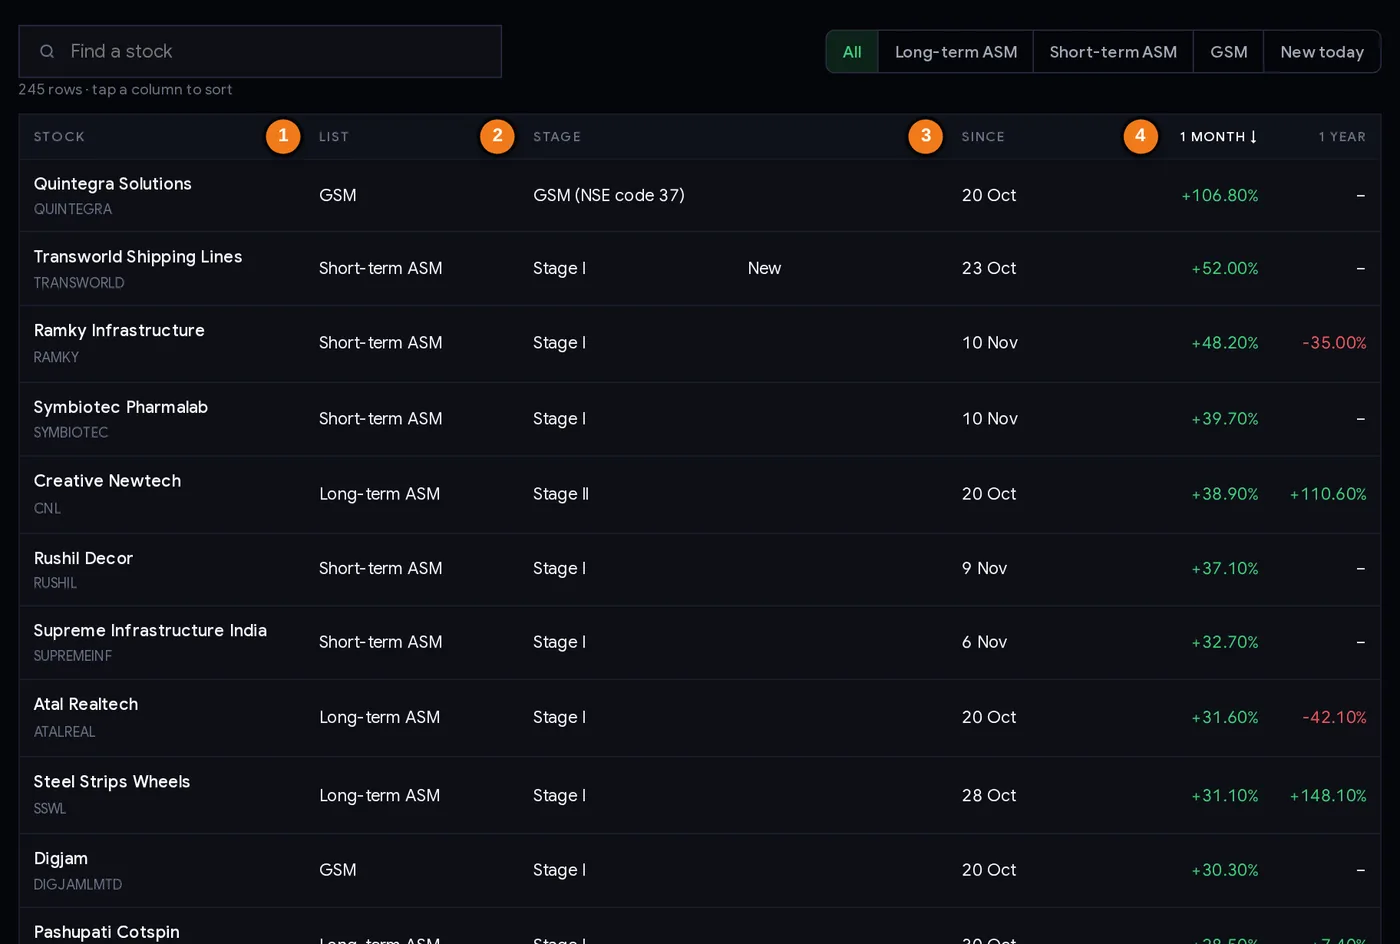
- 1Which list: long-term ASM, short-term ASM or GSM
- 2Stage from NSE’s file
- 3First day ChartMine saw it in that list
- 4Price change over one month (and one year)
Every column explained
| Column | What it tells you |
|---|---|
| Stock | Company name and symbol. A link appears when ChartMine has a page for the stock. |
| List | Long-term ASM, Short-term ASM or GSM. A stock can appear in more than one list. |
| Stage | The stage from NSE’s file (for GSM, see the code table above). |
| New | Marked when the stock was not in that list the previous day. |
| Since | The first day ChartMine saw the stock in that list (tracking began 20 Oct 2026). |
| 1 month / 1 year | Price change over about 21 trading days and one year, when price data is available. The table is sorted by 1 month by default; click a header to re-sort. |
Filters
- All, Long-term ASM, Short-term ASM, GSM: show one list at a time.
- New today: only the additions since the previous list. The fastest daily check.
- Find a stock: type a symbol to see whether a stock you hold or watch is on any list.
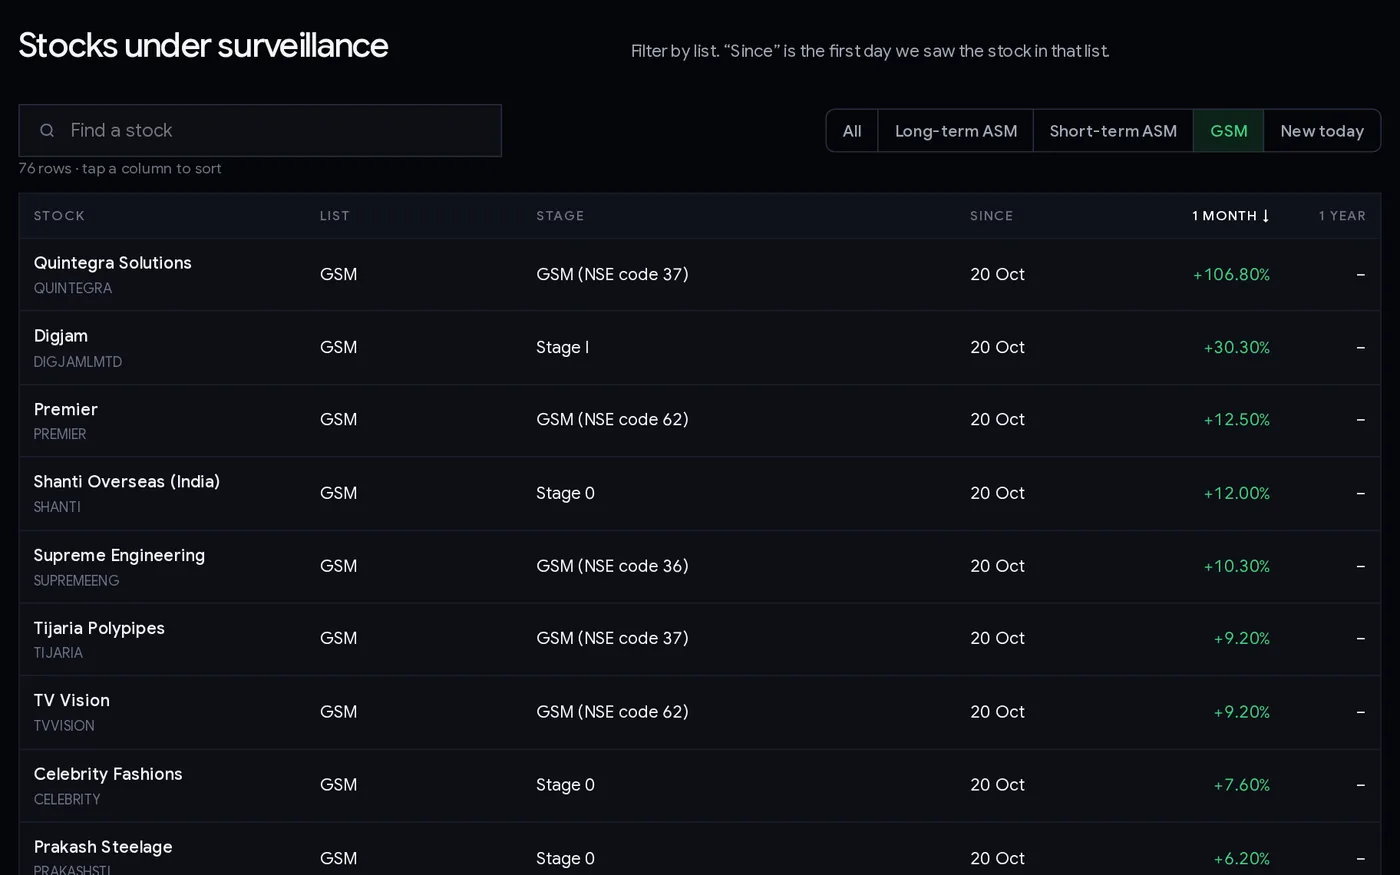
The GSM view is where the combined codes appear. On 9 Nov 2026 the top of the list (sorted by 1-month change) was all Stage 0, meaning shortlisted. Scroll down for the combined codes such as Stage LXII: those companies are often so thinly traded that they have no recent price data, so they sort to the bottom.

The last block lists symbols that dropped out of every list since the previous day. Leaving surveillance usually means the trading restrictions are lifted from the date NSE specifies.
Step by step: a 5-minute daily routine
- Before the market opens, open the page and check the date in the summary (“tracked daily”).
- Type each stock you hold or plan to trade into Find a stock. If it appears, note the list and the stage.
- Click “New today”. These are the freshest additions; if you trade momentum stocks, some of your names may be here.
- For any match, read the stage rules (above) and your broker’s policy. Can you still trade intraday? What margin is needed?
- For GSM or IBC tags, open the company’s filings on NSE and the stock’s page. Find out why before doing anything.
- Check the exits if you were waiting for a stock to come off the list.
- Adjust position size: higher margins mean the same position ties up more capital, and tighter price bands mean you may be unable to exit on a bad day.
How different traders use the list
Playbook A: the intraday and F&O trader’s safety check
Run the Find check on every stock on your watchlist each morning. Drop any name that has just moved to Stage II of short-term ASM or to long-term ASM: the higher margin removes the leverage that intraday trading relies on, and some brokers stop intraday orders altogether. For F&O stocks under long-term ASM, watch for reduced position limits, which can push a stock towards the F&O ban list.
Playbook B: the investor’s red-flag filter
Before buying any small or mid-sized company, check whether it is on the GSM list or carries an IBC or ESM tag. These are signals to slow down and read the annual report, results and shareholding (see shareholding changes) before committing money, and to keep any position small.
Playbook C: the momentum trader’s risk check
Stocks that just entered short-term ASM are often the market’s most violent movers. If you trade them at all, remember three things: liquidity can vanish (case study 1), price limits can lock you in, and the margin you need can double when the stage changes. Use small size and a pre-decided exit, and accept that a stop loss may not fill on a day the stock is locked at its limit.
Locked limits are real risk. When a stock hits its daily price band with only sellers (a lower circuit), there may be no buyers at all. Your stop loss order simply waits. Size positions in surveillance stocks so that two or three locked days would not hurt you badly.
Case studies from NSE’s lists (20 Oct to 9 Nov 2026)
Dates of list changes are from NSE’s daily surveillance files; prices are NSE closing prices (₹).
1. Pashupati Cotspin: up the stairs, down the lift
The stock closed at 68.57 on 12 Oct 2026 and rose almost every day to 94.17 on 21 Oct. It entered short-term ASM on 22 Oct, kept rising to 127.83 on 29 Oct, and moved to long-term ASM on 30 Oct. On 4 Nov it touched 155.49 during the day, then closed at 133.85, down 10%. On 5 Nov and 6 Nov it closed at 120.47 and 108.43: each day the open, high, low and close were the same price, 10% lower, with 100% of traded shares delivered. That is a stock locked at its lower price limit: almost no buyers, so most sellers could not get out. From the 4 Nov high to the 6 Nov close it fell about 30%. Lesson: surveillance stocks can become impossible to sell at any price for days.
2. Spencer’s Retail: surveillance for a fall, then a spike
Spencer’s fell from 27.26 on 13 Oct to 16.19 on 22 Oct (about −41%) and entered short-term ASM Stage I on 23 Oct, closing at 14.80 that day. Then the direction flipped: on 27 and 28 Oct it was locked at the upper limit (17.90 and 19.69, open = high = low = close), reached 21.65 on 29 Oct, and moved to Stage II on 2 Nov. It closed at 19.15 on 6 Nov. Lesson: ASM is about violent moves in either direction, and the moves can reverse sharply while the stock is under watch.
3. Ather Energy: a large, well-known company on the list
Ather closed at 1,380 on 23 Oct, jumped 14% the next session, and reached 1,774.60 on 2 Nov, about +29% in six sessions. It entered short-term ASM on 3 Nov. Turnover on 2 Nov, the day before, was about ₹577 crore, so this was no illiquid penny stock. It closed at 1,821.70 on 6 Nov. Lesson: the list is triggered by price behaviour, not company size or quality. For an investor buying with full payment, Stage I changes little; for leveraged traders, the higher margin matters.
4. Does joining the list predict anything? Not in our sample
We took the 31 stocks added to short-term ASM between 22 Oct and 6 Nov 2026 that had NSE prices, and compared the close before they joined with the 6 Nov close. 19 rose and 12 fell; the median change was +2.2%, with a range from −16.6% to +18.3%. This is a small sample over a few days to two weeks, but it supports the plain conclusion: being added is a risk flag, not a direction signal.
A warning about reading too much into timing: GNG Electronics joined long-term ASM on 6 Nov and fell 19.9% that day (729.55 to 584.35). The data alone cannot tell you whether the listing, news or something else caused the fall.
Common mistakes
- Not checking the list before trading intraday. A stage change can raise your margin overnight or block the order.
- Reading ASM as “the company did something wrong”. NSE says it is not an adverse action; it reflects price behaviour.
- Reading ASM as a buy signal because “the stock is hot”. Our sample split 19 up, 12 down.
- Treating “Stage LXII” as stage 62. It is an NSE code; for 21 GSM stocks on 9 Nov 2026 it meant an insolvency-related tag.
- Relying on a stop loss in a locked stock. At a frozen lower limit there may be no buyers.
- Ignoring broker rules. Your broker can be stricter than the exchange.
- Using big positions in thin stocks. Liquidity in surveillance stocks can disappear quickly.
Surveillance checklist
- I checked whether my stock is on long-term ASM, short-term ASM or GSM today.
- I know its stage and what margin, price band and settlement apply.
- I checked my broker’s policy for that stage (intraday allowed? new buys allowed?).
- For GSM, IBC or ESM tags, I read the company’s filings first.
- My position is small enough to survive two or three locked-limit days.
- I know the stock’s typical daily turnover and can exit without moving the price.
- I am not treating the listing itself as a reason to buy or sell.
Glossary
| ASM | Additional Surveillance Measure: extra rules for stocks with unusual price moves and volatility (short-term and long-term). |
| GSM | Graded Surveillance Measure: stepped restrictions for stocks whose price is not supported by fundamentals. |
| ESM | Enhanced Surveillance Measure: a separate framework for smaller companies. |
| IBC | Insolvency and Bankruptcy Code; an IBC tag means insolvency proceedings are involved. |
| Margin | The money you must put up for a position; 100% margin means paying the full value. |
| Price band (circuit limit) | The maximum a stock may move up or down in one day. |
| Upper / lower circuit | A stock stuck at its daily price limit with only buyers or only sellers. |
| Trade for trade (gross settlement) | Every trade is settled by delivery; same-day buy-and-sell squaring off is not allowed. |
| Additional surveillance deposit | Extra money the exchange holds from buyers in higher GSM stages. |
| Client concentration | How much of a stock’s volume comes from its top 25 trading clients; high concentration is an ASM criterion. |
Questions
What is ASM in the stock market?
ASM (Additional Surveillance Measure) is an NSE and SEBI framework for stocks with unusual price movement or volatility. Stocks under ASM face higher margins and, in later long-term stages, tighter price bands and trade-for-trade settlement. It is a caution flag, not an accusation against the company.
What is the difference between ASM and GSM?
ASM is triggered by price behaviour: sharp moves, high volatility and concentrated trading. GSM is for stocks whose price does not appear supported by the company’s fundamentals and has stricter, stepped restrictions, up to limited trading days at the highest stages.
Can I buy a stock under ASM?
Yes. You can usually buy with full payment, but margins are higher (50% to 100%), later stages tighten price bands and require delivery-based settlement, and many brokers restrict intraday trading. Check your broker’s rules.
How long does a stock stay in the ASM list?
Short-term ASM stocks stay in a stage for at least 5 or 15 trading days and leave when they no longer meet the criteria. Long-term ASM stocks stay at least 90 calendar days and step down one stage at a time on weekly reviews.
What does ASM Stage 4 mean?
In long-term ASM, Stage IV means gross (trade-for-trade) settlement with 100% margin and a 5% price band, so every trade must be settled by delivery. For F&O stocks, no fresh derivative contracts are issued.
Why does the GSM list show Stage LXII?
That is NSE’s surveillance indicator number 62 shown as a Roman numeral, not a stage 62. On 9 Nov 2026 it meant an insolvency (IBC) disclosure or recommenced scrip combined with GSM Stage 0.
Is a stock in ASM a good buy?
Not because of the listing. In our sample of 31 stocks added to short-term ASM in late October and early November 2026, 19 rose and 12 fell by 6 Nov, with a median change of +2.2%. Treat the list as a risk flag.