
☰ All tutorials
Start here
Tool tutorialsHow to trade with ChartMineStocks
Stock monitorMy watchlistStock scores & checklistMarket & sectors
Nifty 50Bank NiftySensexFin NiftyDaily market reportMarket breadthSector rotationSector heatmapStock screenerRelative strength (RS)MCX commodity pricesFear & Greed IndexWhat happens after…Scanners
Top gainers & losersStocks to watch tomorrowNR7 stocks scannerInside bar stocks52-week high stocksGap up & gap down stocksRSI oversold stocksGolden cross stocksSuperTrend buy stocksScan builderEMA 9/21 crossoverMACD crossoverADX strong trendBollinger breakout / squeezeVolume spike stocksOpen = high / open = lowCandlestick pattern scannerNarrow CPR scannerF&O data
F&O ban listOI build-upOption chainPCR & max painExpiry calendarF&O lot sizesOI build-up heatmapPCR trendMax pain trendFutures basisStock screens
Quarterly growersProfit growth stocksLow P/E stocksMutual fund buyingNear 52-week low, growingDebt-free companiesHigh ROE & ROCEMagic Formula stocksLow price-to-bookSmart money
FII / DII dataShareholding changesBig-money footprintShort selling dataF&O positions by participantBulk & block dealsPromoter buyingDelivery percentageCalendars
Results calendarQuarterly results trackerBoard meetingsCorporate actionsIPO calendarIPO performanceResearch & planning
Strategy testerCompare stocksDividend yield stocksASM / GSM listExpiry-day movesSeasonality & stock historyNSE holidays 2026Position size calculatorOption payoff calculatorPivot point calculatorMore
Stock scanners hubStock screensHow to use the Nifty 50 page
A plain-language tutorial on ChartMine’s Nifty 50 page: what the index is, what each number means, how to read the chart, returns and historical data, how traders use the market cards, and real case studies from 2026 and past crashes.
What the Nifty 50 is, in plain words
The Nifty 50 is a single number that tells you how India’s biggest listed companies are doing as a group. It tracks 50 large companies listed on the National Stock Exchange (NSE), such as banks, IT firms, oil, cars and consumer goods makers. When most of these big shares rise, the Nifty 50 rises. When they fall, it falls.
People call it many names: Nifty, Nifty 50, NIFTY. They all mean the same index. It is run by NSE Indices. It started at a base value of 1,000 points on 3 November 1995. So when you read that NIFTY closed at 25,299.35 on 12 November 2026, it means this basket of 50 companies is worth roughly 25 times what it was worth in late 1995 (in price terms, without dividends).
ChartMine’s Nifty 50 page puts everything a learner needs about the index on one screen:
- the latest end-of-day close and the day’s change;
- the all-time high (highest level ever traded) and the record close;
- the 52-week range;
- a chart from 1 month to the full history since 2000;
- returns from 1 week to 10 years;
- a year-by-year table and a free CSV download of daily data;
- a market today panel with PCR, max pain, expiry, FII/DII flows and breadth.
One line to remember: this page shows where the market has been, measured honestly with end-of-day data. It does not tell you where the market will go next.
The page is not live. It is rebuilt every trading evening after NSE publishes its files. The grey label under the title says which session the numbers belong to.
Key ideas: close, all-time high, record close, 52-week range and returns
Before you read the page, it helps to know exactly what each number means. Small differences in definition cause a lot of confusion on social media.
| Term | Meaning in plain words | Nifty 50 on 12 Nov 2026 |
|---|---|---|
| Close | The official level at the end of the trading day (3:30 pm). Most charts and returns use the close. | 25,299.35 (+0.18%) |
| Day’s range | The lowest and highest level traded during that day. | 25,142.95 to 25,384.80 |
| All-time high (intraday) | The highest level ever touched during any session, even for a minute. | 26,373.20 on 5 Jan 2026 |
| Record close | The highest level the index has ever closed at. Usually a little below the intraday high. | 26,328.55 on 2 Jan 2026 |
| Distance from the high | How far the last close is below the all-time high, in %. | −4.07%, 211 sessions after the high |
| 52-week range | The highest and lowest level of the last one year. | High 26,373.20 (5 Jan 2026), low 22,179.90 (8 Oct 2026) |
| Price return | % change in the index level between two dates. Dividends are not counted. | 1 year: −2.2%; 10 years: +204.9% |
| CAGR (a year) | Compounded annual growth rate: the steady yearly rate that would give the same total return. | 10 years: 11.8% a year |
Why two different “highs”?
On 5 January 2026 NIFTY traded as high as 26,373.20 during the day, but it did not close there. Its highest close was three days earlier, 26,328.55 on 2 January 2026. Both are correct; they answer different questions. If someone says “Nifty is 4% below its high”, ask which high they mean.
Price return vs total return
The Nifty 50 you see quoted is a price index. The companies inside it also pay dividends, which an index fund investor receives. So a real investor in a Nifty index fund would have earned a little more than the price returns on this page, before fund costs and taxes. ChartMine shows price returns only and says so on the page.
Why the Nifty 50 matters: advantages and limits
For an Indian trader or investor, the Nifty 50 is the starting point for almost everything else.
Market thermometer
One number sums up the mood of the largest companies. If NIFTY is down 2%, most portfolios are having a bad day.
Benchmark
Mutual funds, PMS and your own portfolio are judged against it. If your stocks rose 8% in a year when NIFTY rose 15%, you lagged the market.
F&O underlying
NIFTY futures and options are among the most traded contracts in the world. PCR, max pain, OI and expiry all refer to this index.
Context for stocks
Many stock moves are simply the market moving. Comparing a stock with NIFTY shows whether it is truly strong or weak.
Limits you should know
- Large companies only. NIFTY says little about small and midcap stocks. On some days NIFTY rises while most smaller stocks fall. Check market breadth for the wider picture.
- Heavy in a few sectors. On the constituent list dated 10 Nov 2026, 12 of the 50 companies are in financial services (banks, NBFCs, insurers and others). A big move in banks moves NIFTY a lot.
- Free-float weights. Bigger companies carry more weight, so a handful of heavyweights can drive the index on a given day.
- End of day. The page shows closing data, not live prices. It is for study and planning, not for timing an intraday trade.
- History is not a forecast. An average return of about 11.8% a year over the last 10 years does not mean the next year will be anything like it. In 2008 NIFTY fell 51.8%; in 2009 it rose 75.8%.
A tour of the Nifty 50 page
Open the Nifty 50 page. The top strip gives the four numbers most people search for.

- 1Last close and the day’s change
- 2All-time high (intraday) and its date
- 3Distance from the all-time high and sessions since
- 452-week high and low with dates
| Box | What it shows | How to read it |
|---|---|---|
| Close on <date> | The latest end-of-day close and the % change from the previous close | Green = up day, red = down day. Always check the date. |
| All-time high | Highest intraday level ever, with its date | The level everyone talks about when NIFTY is “near a record”. |
| From all-time high | % gap between the last close and the all-time high, and sessions since the high | Small gap = near the top. A long count of sessions means the market has gone sideways or down for a while. |
| 52-week range | The one-year high and low with dates | Tells you where today sits inside the last year’s range. |
The chart
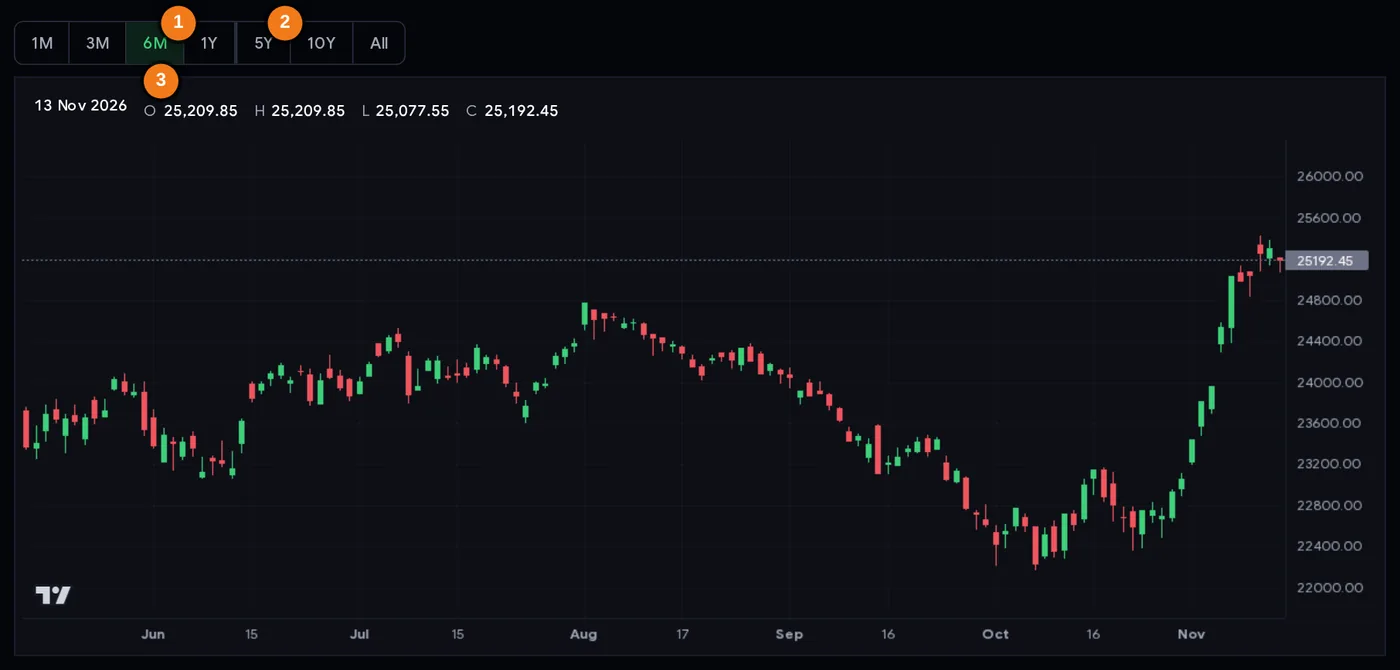
- 11M to 1Y: daily candlesticks (opens on 6M)
- 25Y, 10Y and All: weekly closing line
- 3Legend: open, high, low and close of the day under your cursor
The chart opens on 6M (six months). The buttons 1M, 3M, 6M and 1Y show daily candlesticks: each candle is one day, green if the close was above the open, red if below. 5Y, 10Y and All switch to a line of weekly closes, which is easier to read over long periods. Move your mouse (or finger) over the chart and the legend at the top shows that day’s open, high, low and close (O, H, L, C), or the week’s close on the long views. The mouse wheel does not zoom, so the page scrolls normally.
All-time high block
Below the chart, four boxes repeat the high in more detail: intraday all-time high, record close, how far the last close is from the record close, and how many points NIFTY needs to rise to reach the all-time high. On 12 Nov 2026 that gap was 1,073.85 points.
Returns

- 1Short periods show the % change and the starting level
- 21-year price return
- 3Longer periods also show the compounded rate a year
Seven boxes show the price return over 1 week, 1 month, 3 months, 1 year, 3 years, 5 years and 10 years. Short periods show the starting level (“from 22,363.35”). Periods of 3 years and more also show the compounded yearly rate. The sentence under the boxes gives the return since the start of the data on 3 January 2000.
Historical data table and CSV
Each row is one calendar year: year-end close, the year’s return, the highest close and the lowest close with dates. The year that holds the record close is highlighted. The button under the table downloads a CSV with the daily open and close of every session since 3 January 2000 (6,680 rows on 12 Nov 2026). You can open it in Excel or Google Sheets for your own study.
Market today
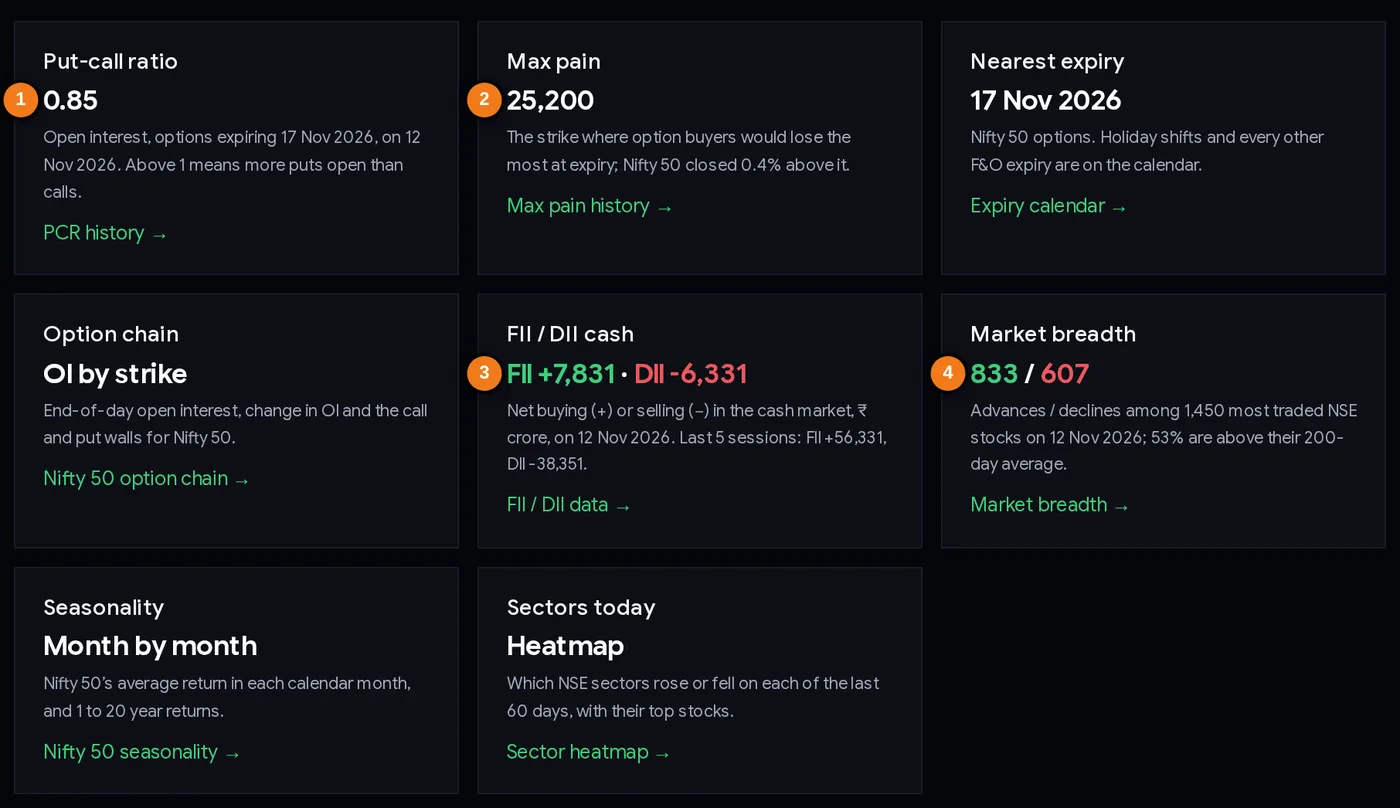
- 1Put-call ratio for the nearest expiry
- 2Max pain and the distance of the close from it
- 3FII and DII net cash buying or selling, ₹ crore
- 4Market breadth: advances / declines
| Card | What it shows | Go deeper |
|---|---|---|
| Put-call ratio | Open put contracts divided by open call contracts for the nearest expiry | PCR trend |
| Max pain | The strike where option buyers as a group would lose the most at expiry, and how far NIFTY closed from it | Max pain trend |
| Nearest expiry | The next NIFTY options expiry date | Expiry calendar |
| Option chain | Link to open interest by strike | NIFTY option chain |
| FII / DII cash | Net buying (+) or selling (−) by foreign and domestic institutions, ₹ crore, and the 5-session total | FII DII data |
| Market breadth | Advancing vs declining stocks and % above the 200-day average | Market breadth |
| Seasonality, Sectors today | Links to month-by-month returns and the sector heatmap | Nifty 50 seasonality |
At the bottom, Go deeper links to event studies (Budget day, RBI policy, election results, monthly expiry, Muhurat trading) and to the Bank Nifty, Sensex and Fin Nifty pages.
Step-by-step: a 5-minute evening routine with the Nifty 50 page
- Check the date. Read the label under the title. Make sure the data is for the session you think it is, especially after a holiday (NSE was shut on 10 Nov 2026 for Diwali Balipratipada).
- Read the close and the change. Note whether the day was up or down and by how much. A move above 1% either way is a big day for NIFTY: in the 250 sessions to 11 Nov 2026, only 22.8% of days moved more than 1%.
- Place today in the bigger picture. Look at “From all-time high” and the 52-week range. Is NIFTY near the top of its year, in the middle, or near the bottom?
- Switch the chart to 1Y, then 5Y. Ask: is the trend rising, falling or flat? Was today’s move unusual compared with recent candles?
- Read the returns row. Compare 1 month with 1 year. A strong month inside a weak year (as on 12 Nov 2026: +13.1% in a month, −2.2% in a year) tells you a recovery is under way after a fall, not that the market has been strong all year.
- Scan Market today. Note PCR, max pain and days to expiry if you trade options; note FII/DII flows and breadth if you trade stocks.
- Write one sentence in a journal. For example: “NIFTY 4% below the high, up 13% in a month, FIIs buying 5 sessions in a row, breadth positive.” Over weeks this builds your feel for the market far better than watching prices all day.
None of these readings is a buy or sell signal on its own. Use them as context, decide your risk first, and use a stop loss on every trade. The position size calculator helps you size a trade to the amount you can afford to lose.
How traders and investors use the page: three playbooks
1. Long-term investor: set realistic expectations
Use the year-by-year table, not the last few weeks. Since 2001 NIFTY ended 21 of 25 full calendar years higher, but the bad years were very bad (−51.8% in 2008, −24.6% in 2011). Over the 10 years to 12 Nov 2026 it compounded at about 11.8% a year in price terms; over 5 years, 6.9% a year. Investors use this range of outcomes to decide how much equity they can hold without panicking in a bad year. Many prefer regular investing (SIP) to guessing the best entry day.
2. Swing trader: know where the index sits
Before taking a position in a stock, swing traders look at whether NIFTY is near its 52-week high, recovering from a low, or falling. Many prefer to be more careful with new long trades when the index is in a steady decline, and to trade smaller when it is very stretched after a fast move. Combine this page with market breadth (are most stocks joining the move?) and the sector heatmap (which sectors lead?).
3. Options trader: read expiry context
The Market today cards tell you the nearest expiry, the PCR and max pain. On 12 Nov 2026 NIFTY closed at 25,299.35 with max pain at 25,200 (0.4% away) and PCR 0.85 for the 17 Nov expiry. Option traders use these as a map of where open interest is concentrated, then study the option chain for the call and put walls. Remember that PCR and max pain describe positioning; they do not predict where NIFTY will close. NIFTY options have one lot of 65 units (lot size on the F&O lot size page for Nov 2026), so check the money at risk per lot before you trade.
Case studies from real data
All numbers below come from ChartMine’s Nifty 50 data (NSE end-of-day closes). They describe what happened; they are not a forecast.
Case 1: 2026, a record in January, then two falls
NIFTY made its record close of 26,328.55 on 2 January 2026 and its intraday all-time high of 26,373.20 on 5 January. It then slipped. Month-end closes tell the story:
| Month-end 2026 | NIFTY close |
|---|---|
| January | 25,320.65 |
| February | 25,178.65 |
| March | 22,331.40 |
| June | 23,865.75 |
| August | 24,080.40 |
| September | 22,620.45 |
| October | 23,053.10 |
From the end of February to the March low (22,331.40 on 30 March) NIFTY fell 11.3%. It recovered through mid-year, fell again in September, and made its lowest close of the year, 22,231.80, on 8 October 2026: 15.6% below the January record close. Lesson: being near a record does not protect you from a 10-15% fall within weeks.
Case 2: the fast rally of late October and November 2026
From 23,053.10 on 30 October to 25,299.35 on 12 November, NIFTY rose 9.7% in eight sessions. The biggest days were 5 November (+2.40%) and 6 November (+2.01%). The FII/DII card shows who was behind it: from 2 to 12 November, FIIs were net buyers in the cash market on all eight sessions, about ₹73,566 crore in total, while DIIs were net sellers of about ₹46,135 crore. The 1-month return box jumped to +13.1%.
Lesson: the returns row and the FII/DII card together explain a move better than the price alone. But a fast rally also means bigger daily swings; India VIX rose from 15.30 on 30 October to 17.47 on 6 November.
Case 3: how deep falls go, and how long recovery takes
Using daily closes since 2000, these were the falls of more than 20% from a previous record close:
| Peak close | Bottom | Fall | New record close |
|---|---|---|---|
| 11 Feb 2000 | 21 Sep 2001 | −51.4% | 18 Dec 2003 |
| 8 Jan 2008 | 27 Oct 2008 | −59.9% | 5 Nov 2010 |
| 5 Nov 2010 | 20 Dec 2011 | −28.0% | 3 Nov 2013 |
| 3 Mar 2015 | 25 Feb 2016 | −22.5% | 14 Mar 2017 |
| 14 Jan 2020 | 23 Mar 2020 | −38.4% | 9 Nov 2020 |
(Shorter falls of about 30% also happened in 2004 and 2006.) The 2008 fall took almost three years to recover; the 2020 crash took under eight months. Lesson: deep falls are a normal part of owning the index, and nobody knows in advance which kind of recovery will follow. Size your positions so you can survive the slow kind.
Common mistakes
- Treating the close as a live price. The page is end of day. During market hours NIFTY will already be somewhere else.
- Mixing up the intraday high and the record close. They differ (26,373.20 vs 26,328.55 in 2026). Say which one you mean.
- Ignoring dividends in long-term comparisons. The page shows price returns. Fund returns include dividends and costs, so they will not match exactly.
- Extrapolating the last month. A +13.1% month does not continue at that pace. The same year had a −11.3% fall in March.
- Assuming NIFTY = your portfolio. If you hold small caps, your results can differ a lot. Check breadth.
- Reading PCR or max pain as a prediction. They show positioning. Prices can and do close far from max pain.
- Trading without a stop loss because “the index always comes back”. It took NIFTY almost three years to get back to its 2008 high. Leveraged F&O positions cannot wait that long.
Checklist before you use NIFTY data in a decision
- I checked the date of the data and it is the session I meant.
- I know whether I am looking at a close, an intraday high or a record close.
- I placed today’s close inside the 52-week range and against the all-time high.
- I looked at the chart on at least two time frames (1Y and 5Y).
- I compared the short returns (1 week, 1 month) with the long ones (1 year, 5 years).
- I checked breadth and FII/DII flows for context.
- If I trade options, I know the expiry date, lot size and how much one lot can lose.
- I decided my stop loss and position size before the trade, not after.
Glossary
| Term | Meaning |
|---|---|
| Index | A number that tracks the combined price of a basket of shares. |
| Nifty 50 | NSE’s benchmark index of 50 large companies; base 1,000 on 3 Nov 1995. |
| Constituent | A company that is part of the index. |
| Free-float weight | Each company’s share of the index, based on the value of shares available to the public. |
| Close | The official level at the end of the session. |
| OHLC | Open, high, low, close: the four prices of a candle. |
| Candlestick | A chart bar showing one period’s OHLC; green = closed higher than it opened. |
| All-time high | The highest level ever traded during a session. |
| Record close | The highest closing level ever. |
| 52-week range | The highest and lowest level of the last year. |
| Drawdown | The % fall from a previous peak. |
| CAGR | Compounded annual growth rate: the steady yearly return that gives the same result. |
| Price return | Return from the index level only, without dividends. |
| PCR | Put-call ratio: open puts ÷ open calls. |
| Max pain | The strike at which option buyers as a group lose the most at expiry. |
| FII / DII | Foreign institutional investors / domestic institutional investors (mutual funds, insurers, banks). |
| Breadth | How many stocks are rising versus falling. |
| India VIX | NSE’s volatility index: the size of NIFTY moves that option prices expect. |
Questions
How do I read the Nifty 50 chart on ChartMine?
The 1M, 3M, 6M and 1Y buttons show daily candlesticks (green when the close is above the open). 5Y, 10Y and All show a line of weekly closes since 2000. Hover over the chart to see the open, high, low and close of any day.
What is the difference between Nifty’s all-time high and record close?
The all-time high is the highest level traded during any session; the record close is the highest closing level. In 2026 NIFTY touched 26,373.20 on 5 January but its record close was 26,328.55 on 2 January.
Do Nifty 50 returns include dividends?
No. The returns on the page are price returns of the index level. Investors in a Nifty index fund also receive dividends, so their returns before costs are a little higher.
How much has Nifty 50 returned in 10 years?
From 8,296.30 on 11 November 2016 to 25,299.35 on 12 November 2026, NIFTY rose 204.9%, about 11.8% a year compounded, in price terms. Past returns do not tell you future returns.
How can I download Nifty 50 historical data for free?
Use the Download button under the historical data table. It gives a CSV of the daily open and close for every session since 3 January 2000, updated every trading evening.
Is the Nifty 50 page live?
No. It shows end-of-day data and is rebuilt every trading evening after NSE publishes its files. The label under the title tells you which session the numbers belong to.
Can I use the Nifty 50 page to decide when to buy?
It is an education and research page, not advice. It shows where the index has been. Use it as context, plan your risk with a stop loss, and remember ChartMine is not a SEBI-registered adviser.