
☰ All tutorials
Start here
Tool tutorialsHow to trade with ChartMineStocks
Stock monitorMy watchlistStock scores & checklistMarket & sectors
Nifty 50Bank NiftySensexFin NiftyDaily market reportMarket breadthSector rotationSector heatmapStock screenerRelative strength (RS)MCX commodity pricesFear & Greed IndexWhat happens after…Scanners
Top gainers & losersStocks to watch tomorrowNR7 stocks scannerInside bar stocks52-week high stocksGap up & gap down stocksRSI oversold stocksGolden cross stocksSuperTrend buy stocksScan builderEMA 9/21 crossoverMACD crossoverADX strong trendBollinger breakout / squeezeVolume spike stocksOpen = high / open = lowCandlestick pattern scannerNarrow CPR scannerF&O data
F&O ban listOI build-upOption chainPCR & max painExpiry calendarF&O lot sizesOI build-up heatmapPCR trendMax pain trendFutures basisStock screens
Quarterly growersProfit growth stocksLow P/E stocksMutual fund buyingNear 52-week low, growingDebt-free companiesHigh ROE & ROCEMagic Formula stocksLow price-to-bookSmart money
FII / DII dataShareholding changesBig-money footprintShort selling dataF&O positions by participantBulk & block dealsPromoter buyingDelivery percentageCalendars
Results calendarQuarterly results trackerBoard meetingsCorporate actionsIPO calendarIPO performanceResearch & planning
Strategy testerCompare stocksDividend yield stocksASM / GSM listExpiry-day movesSeasonality & stock historyNSE holidays 2026Position size calculatorOption payoff calculatorPivot point calculatorMore
Stock scanners hubStock screensHow to use the Golden cross stocks scanner
A plain-language tutorial on moving-average crosses: what the 50-DMA and 200-DMA are, how the scanner finds golden and death crosses, an honest one-year test, a tour of the screen, and three playbooks with real case studies.
What a golden cross is, in plain words
A moving average is the average closing price over a number of days, recalculated every day. It smooths out the daily noise so you can see the direction of the trend.
- The 50-day moving average (50-DMA) shows the medium-term trend, roughly the last two and a half months.
- The 200-day moving average (200-DMA) shows the long-term trend, roughly the last ten months.
A golden cross happens when the 50-DMA rises above the 200-DMA. It means the recent average price has climbed above the long-term average: the medium-term trend has turned up. A death cross is the opposite: the 50-DMA falls below the 200-DMA.
The names sound dramatic, and the crosses get a lot of attention in the financial press, especially when they happen on NIFTY or a big stock. Many investors use them as a simple trend filter.
One line to remember: a golden cross confirms a turn that has already happened. Because both averages are slow, the cross usually comes well after the price turned.
The Golden cross stocks scanner lists every F&O stock and main index whose 50-DMA crossed its 200-DMA in the last five sessions, up (golden) or down (death), every evening.
How the scanner finds a cross (with a real example)
- Each evening it calculates the 50-day and 200-day simple averages of closing prices (adjusted for splits and bonuses) for today and each of the last five sessions.
- A golden cross on a given day: the day before, the 50-DMA was at or below the 200-DMA; on that day it is above.
- A death cross: the day before, the 50-DMA was at or above; on that day it is below.
- If a cross happened in the last five sessions, the stock is listed. “Crossed today” keeps only the crosses on the scan day itself.
Example: Divi’s Laboratories, 18 May 2026
On 18 May 2026 Divi’s 50-DMA was ₹6,298.76 and its 200-DMA ₹6,298.22: the 50-day had just moved above the 200-day by about 50 paise. The stock itself closed at ₹6,835, already about 8.5% above both averages. That gap between price and averages is typical: by the time the slow averages cross, the price has usually moved a long way.
Why only “the last five sessions”? A stock can stay with its 50-DMA above the 200-DMA for months. The scanner lists only fresh crosses, so on many days the Golden cross tab is short or empty. On 6 Nov 2026 it had none, while the Death cross tab had five (AU Small Finance Bank, Bharat Forge, ENRIN, Hero MotoCorp, IndusInd Bank).
Types of moving-average crosses
| Signal | Rule | What traders read into it |
|---|---|---|
| Golden cross | 50-DMA crosses above 200-DMA | Medium-term trend turning up. Investors may start looking for buys. |
| Death cross | 50-DMA crosses below 200-DMA | Medium-term trend turning down. Investors may reduce or avoid. |
| Price cross of the 200-DMA | Close crosses the 200-DMA itself | Earlier than the golden cross, but more false signals. Use the 200-DMA column and trend filter. |
| Faster crosses | e.g. 20-DMA over 50-DMA | Shorter-term trend changes; more frequent and noisier. Not scanned here. |
| Whipsaw | Golden and death crosses alternating within weeks | A sideways market; the averages are flat and keep crossing. |
Simple vs exponential averages
The scanner uses simple moving averages (every day counts equally). Some charts use exponential averages (EMA), which give more weight to recent days and cross a little earlier. If your chart uses EMAs, your cross dates may differ by a few days.
Why investors watch crosses: advantages and limits
✅ Simple trend filter
“Only buy stocks whose 50-DMA is above the 200-DMA” keeps you out of many long downtrends.
✅ Rare, so it gets attention
Each stock crosses only a few times a year, so a cross is a clear, objective event.
✅ Fewer decisions
Slow signals mean less trading and fewer emotional reactions to daily noise.
✅ Context columns
Volume, RSI and distance from the 52-week high show how stretched the stock is at the cross.
The limits: what our own data says
We rebuilt the scanner’s history for 27 Oct 2025 to 6 Nov 2026 (217 F&O stocks, same adjusted data and code) and found 140 fresh golden crosses and 206 fresh death crosses. Each was compared with the average F&O stock over the same days. Over the year NIFTY fell about 3.6%, from 25,966 to 25,030, and moved mostly sideways, which is exactly the kind of market where crosses struggle.
| After the cross | Golden cross | Death cross |
|---|---|---|
| Cases | 140 | 206 |
| Up after 20 sessions | 40.6% | 47.5% |
| 20 sessions: versus the average stock | −0.49% | −0.81% |
| Up after 60 sessions | 37.5% | 46.3% |
| 60 sessions: versus the average stock | −1.48% | +0.30% |
| Beat the average stock over 60 sessions | 38% | 45% |
- Golden crosses did slightly worse than the average stock in this period, and most of them were lower 60 sessions later.
- Death crosses did not lead to extra losses over 60 sessions.
- The reason is the lag: by the time a cross happens, the price has often already made most of its move and can be due for a pause. In a choppy market, crosses also flip back and forth (see Larsen & Toubro below).
- This is one year of data, in a sideways-to-down market. In long, strong trends crosses tend to look better. Treat the result as a warning, not a law.
So how should you use it? As a slow trend filter (which stocks to consider, which to avoid), not as a buy or sell signal. Entries and exits still need their own rules, a stop loss and position sizing.
A tour of the scanner screen
Open the Golden cross stocks scanner. There are three tabs, the filters and the results table, sorted by volume (highest first).

- 1Scan for: pick a scan date; the latest is first.
- 2Golden cross: 50-DMA crossed above the 200-DMA in the last 5 sessions.
- 3Crossed today: golden crosses on the scan day.
- 4Death cross: 50-DMA crossed below the 200-DMA in the last 5 sessions.
The tab counts are usually small: crosses are rare events. An empty Golden cross tab is normal. The table picture below shows the Death cross tab of 6 Nov 2026.
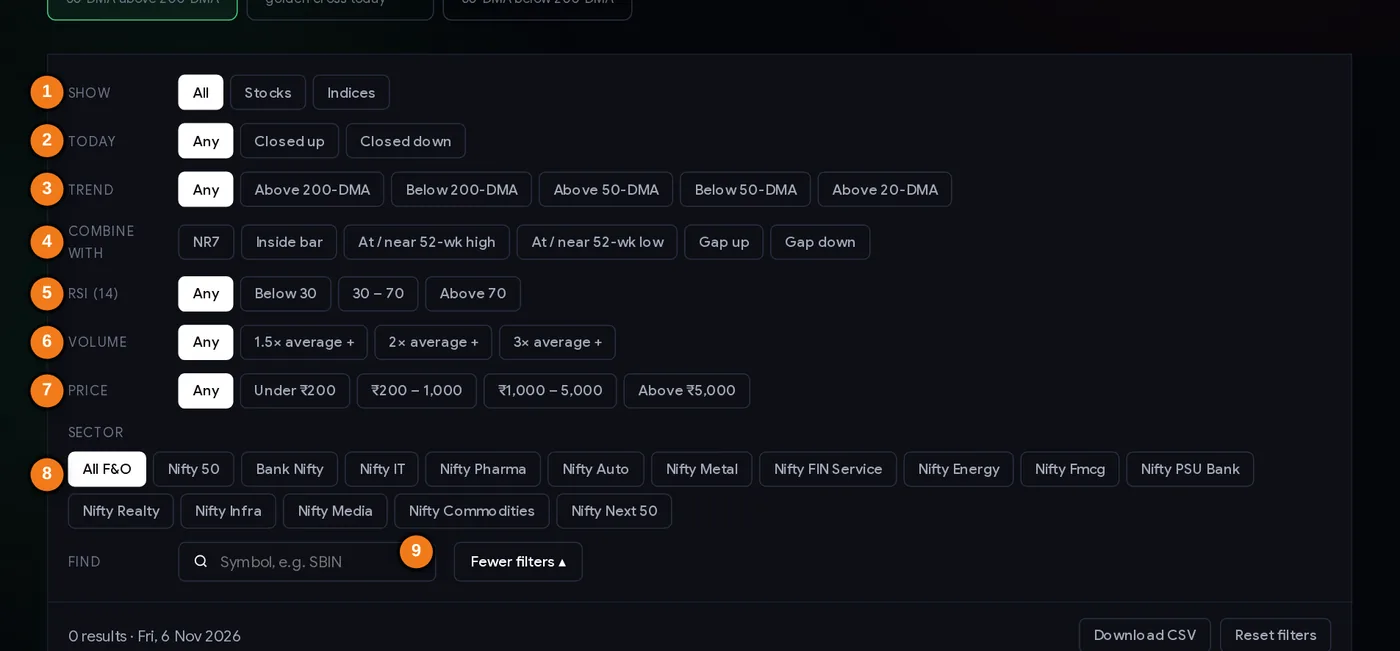
- 1Show: stocks or indices
- 2Today: closed up or down
- 3Trend: versus the 20-, 50- or 200-day average
- 4Combine with another setup
- 5RSI (14)
- 6Volume versus the 20-day average
- 7Price band
- 8Sector (index membership)
- 9Find a symbol
The filters
- Show: stocks, indices or both. An index cross (NIFTY, BANKNIFTY) is a market-wide trend signal.
- Today: closed up or down on the scan day.
- Trend: close versus the 20-, 50- or 200-day average. A golden-cross stock whose price has already fallen back below its 50-DMA is weakening.
- Combine with: NR7, inside bar, 52-week high or low, gaps.
- More filters: RSI, volume, price band and sector.
- Find a symbol; filters stay in the page address.
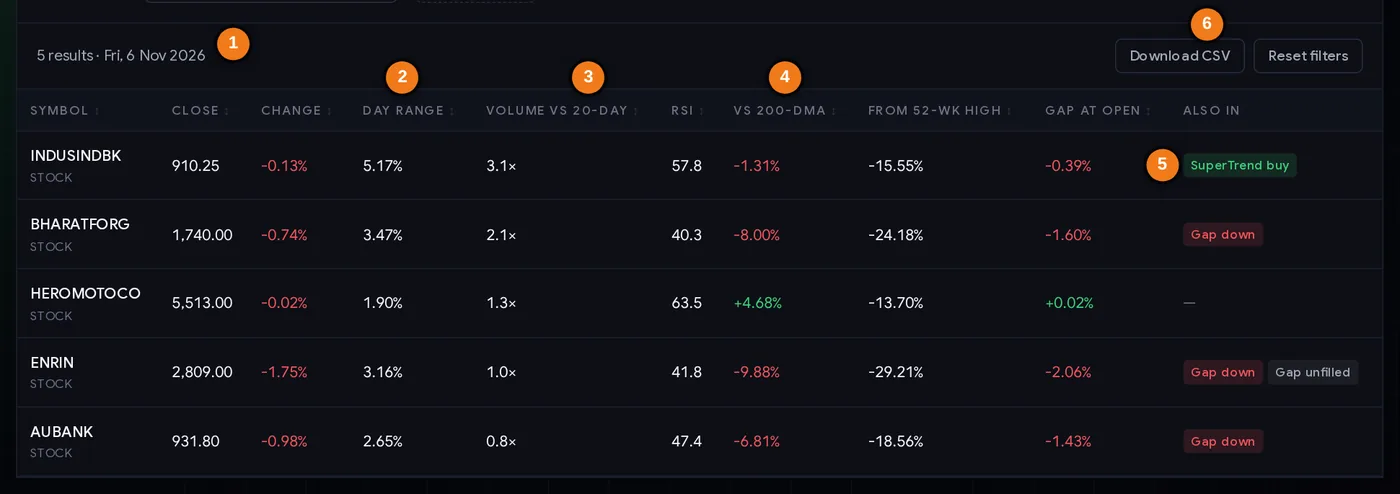
- 1Result count and scan date
- 2Day range %
- 3Volume versus the 20-day average
- 4Distance from the 200-day average
- 5Other scans the stock matched today
- 6Download the list as CSV
Every column explained
| Column | What it tells you |
|---|---|
| Close / Change | The scan-day close and % change. |
| Day range | (High − Low) ÷ Close. |
| Volume vs 20-day | Default sort. A cross on rising volume shows more participation. |
| RSI | Momentum. A golden cross with RSI already above 70 means the stock has run hard into the signal. |
| vs 200-DMA | How far the price is from the long-term average. Far above at a golden cross = late signal. |
| From 52-wk high | Where the stock sits in its yearly range. |
| Gap at open | The scan day’s opening gap. |
| Also in | Other scans matched. Watch for conflicts: on 6 Nov 2026 IndusInd Bank showed a death cross and a SuperTrend buy at the same time. |
Note on older dates. The golden/death cross tabs were added to the scanner on 8 Nov 2026, so earlier dates in the date box show no crosses. The history in this tutorial was rebuilt separately with the same code.
Step by step: a weekly routine
Because crosses are slow, a weekly check is enough for most investors.
- Open the scanner once or twice a week and check the date.
- Look at both tabs. Golden crosses are candidates for a watchlist; death crosses are candidates to review in your holdings.
- Check how stretched the price is (vs 200-DMA, RSI). A golden cross with the price 15% above the 200-DMA is a late signal; waiting for a pullback may be wiser.
- Check the history on the chart. Has the stock crossed back and forth recently? Repeated crosses mean a sideways stock.
- Check fundamentals if you are investing: quarterly growers, high ROE, results trend.
- Decide an entry rule separate from the cross (for example, a pullback toward the 50-DMA that holds) and a stop (for example, a close below the 200-DMA).
Three playbooks
Playbook A: the trend filter for investors
Keep a simple rule: consider buying only stocks whose 50-DMA is above the 200-DMA, and review any holding that makes a death cross. The scanner tells you when a stock moves from one group to the other. This does not pick winners; it tries to avoid long downtrends.
Playbook B: golden cross plus pullback
- Golden cross in the last five sessions.
- Do not buy immediately. Wait for the price to pull back toward the 50-DMA and hold it (a close back up after touching it).
- Stop: a close below the 200-DMA.
- Exit: trail under rising swing lows, or on a death cross for a long-term holder.
Playbook C: index crosses as market weather
A golden or death cross on NIFTY or BANKNIFTY is a broad signal. Some traders reduce position sizes after an index death cross and increase them after a golden cross, without changing their stock-picking method.
Slow signals need wide stops. A stop at the 200-DMA can be far away. Use the position size calculator so a wide stop still means a small rupee loss.
Case studies from 2026
Four real crosses. Prices in ₹ from NSE’s daily files, adjusted for corporate actions.
1. Divi’s Laboratories, 18 May 2026: the slow winner
Golden cross with the stock at 6,835. Twenty sessions later it was 1.8% lower, but 60 sessions later it was 25.8% higher, and in July it was making new 52-week highs. A patient investor using the cross as a filter was rewarded; a short-term trader would have been disappointed at first.
2. Tata Power, 21 Apr 2026: the late signal
Golden cross on the same day as a new 52-week high, with RSI above 70: the stock at 436.05 was already far above both averages. It rose 5.9% in five sessions, then turned: 20 sessions later it was 5.2% below the cross price and 60 sessions later 13.5% below. Lesson: when the cross arrives after a big run, much of the move is already done.
3. Larsen & Toubro, May–Sep 2026: the whipsaw
Death cross on 14 May (close 3,940.40), golden cross on 3 Jun (3,953.20), death cross again on 4 Sep (3,964.10). Three “major” signals in four months, and the price barely moved: within about 0.6% across all three. An investor acting on each cross would have paid brokerage and taxes for nothing. Flat averages cross often.
4. Tech Mahindra, 2026: back and forth
Golden cross on 1 Jan 2026 at 1,607.70. Sixty sessions later the stock was 12.6% lower and a death cross followed on 20 Mar. Then another golden cross on 5 Aug at 1,650. Over seven months, the crosses described the trend changes after the fact rather than ahead of them.
Common mistakes
- Buying on the cross day. In our test, golden crosses lagged the average stock afterwards.
- Selling everything on a death cross. Death crosses did not lead to extra losses over 60 sessions in our data.
- Ignoring how far the price has run. Tata Power crossed at a new high with RSI above 70.
- Acting on every cross in a sideways stock. L&T crossed three times with almost no price change.
- Mixing up SMA and EMA crosses. Dates differ; know which your chart uses.
- Expecting a short-term signal. These are slow tools for weeks and months.
- No stop loss because “the trend is up”. Trends change.
Pre-trade checklist
- The cross is fresh (last five sessions) and the date is the latest scan.
- The averages are sloping in the direction of the cross, not flat (check the chart).
- The price is not extremely stretched from the 200-DMA; RSI noted.
- No recent back-and-forth crosses in the same stock.
- Fundamentals or results trend checked if investing.
- A separate entry rule (pullback, breakout) and a stop decided.
- Position size from the stop distance.
- Review plan: what you will do on the next opposite cross.
Glossary
| Moving average (DMA) | The average closing price of the last N days, recalculated daily. |
| 50-DMA / 200-DMA | Medium-term and long-term moving averages. |
| Golden cross | 50-DMA crossing above the 200-DMA. |
| Death cross | 50-DMA crossing below the 200-DMA. |
| SMA / EMA | Simple (equal weights) / exponential (more weight on recent days) average. |
| Lag | The delay between a price turn and the indicator showing it. |
| Whipsaw | Signals flipping back and forth in a sideways market. |
| Trend filter | A rule that limits trades to the direction of the larger trend. |
Questions
What is a golden cross in stocks?
It is when a stock’s 50-day moving average rises above its 200-day moving average, a sign that the medium-term trend has turned up. ChartMine’s scanner lists F&O stocks and indices with a golden or death cross in the last five sessions.
Is a golden cross a buy signal?
Not reliably. In ChartMine’s test of 140 golden crosses (Oct 2025 to Nov 2026), the stocks did about 1.5% worse than the average F&O stock over the next 60 sessions. Most investors use it as a trend filter, with separate entry rules and a stop loss.
What is a death cross?
The 50-day moving average falling below the 200-day moving average. It signals a weakening medium-term trend. In our test, death-cross stocks did not do worse than average over the following 60 sessions.
Why is the golden cross tab empty?
The scanner lists only fresh crosses from the last five sessions. Crosses are rare, so on many days there are none. On 6 Nov 2026 there were no golden crosses and five death crosses among F&O stocks.
Does the scanner use SMA or EMA?
Simple moving averages (SMA) of daily closing prices, adjusted for splits and bonuses. Charts using EMAs will show crosses a few days earlier or later.
How long after a golden cross does a stock rise?
There is no fixed delay, and many do not rise. In our study 40.6% of golden-cross stocks were higher after 20 sessions and 37.5% after 60 sessions, in a year when NIFTY was slightly down.