
☰ All tutorials
Start here
Tool tutorialsHow to trade with ChartMineStocks
Stock monitorMy watchlistStock scores & checklistMarket & sectors
Nifty 50Bank NiftySensexFin NiftyDaily market reportMarket breadthSector rotationSector heatmapStock screenerRelative strength (RS)MCX commodity pricesFear & Greed IndexWhat happens after…Scanners
Top gainers & losersStocks to watch tomorrowNR7 stocks scannerInside bar stocks52-week high stocksGap up & gap down stocksRSI oversold stocksGolden cross stocksSuperTrend buy stocksScan builderEMA 9/21 crossoverMACD crossoverADX strong trendBollinger breakout / squeezeVolume spike stocksOpen = high / open = lowCandlestick pattern scannerNarrow CPR scannerF&O data
F&O ban listOI build-upOption chainPCR & max painExpiry calendarF&O lot sizesOI build-up heatmapPCR trendMax pain trendFutures basisStock screens
Quarterly growersProfit growth stocksLow P/E stocksMutual fund buyingNear 52-week low, growingDebt-free companiesHigh ROE & ROCEMagic Formula stocksLow price-to-bookSmart money
FII / DII dataShareholding changesBig-money footprintShort selling dataF&O positions by participantBulk & block dealsPromoter buyingDelivery percentageCalendars
Results calendarQuarterly results trackerBoard meetingsCorporate actionsIPO calendarIPO performanceResearch & planning
Strategy testerCompare stocksDividend yield stocksASM / GSM listExpiry-day movesSeasonality & stock historyNSE holidays 2026Position size calculatorOption payoff calculatorPivot point calculatorMore
Stock scanners hubStock screensHow to use the Strategy tester
A complete, plain-language guide to backtesting on ChartMine: the rules you can test, how the trades are filled, how to read every number, and the traps (overfitting, costs, survivorship) shown with our own tests on 12 large NSE stocks.
What the strategy tester does, in plain words
Every trader has ideas like “buy when the price crosses above the 50-day average” or “buy a breakout to a 20-day high”. The honest question is: what would have happened if I had followed this rule, every time, without exceptions? Answering that question with past prices is called backtesting.
The Strategy tester does it for you in the browser. You pick an NSE stock, a rule for buying (the entry) and a rule for selling (the exit). The tool replays the last two years of that stock’s daily prices, takes every trade the rule asks for, charges a cost on each one, and shows you:
- every buy and sell as arrows on a candlestick chart;
- an equity curve: what ₹100 put into the rule would have become, next to ₹100 simply bought on day one and held;
- the number of trades, the win rate, the average trade, and the worst fall along the way;
- a table of every trade with dates, prices, days held and why it was sold.
One line to remember: a backtest tells you how a rule behaved on one stock in one stretch of the past. It is a way to understand an idea and to throw out bad ones cheaply. It is not a forecast and not a promise.
This tutorial explains the rules you can test, how the tool fills the trades, how to read every number on the screen, and, most importantly, the traps that make backtests look better than real trading: overfitting, costs and survivorship. We ran our own tests on 12 large NSE stocks to show these traps with real numbers.
The rules you can test
The tester keeps things simple on purpose: long trades only (you buy first, sell later), one position at a time, daily candles.
Entry rules (“Buy when”)
| Entry | What has to happen | The idea behind it |
|---|---|---|
| Price crosses above the 50-day average | Today’s close is above the 50-day simple moving average (SMA) and yesterday’s close was not. | Trend following: a medium-term trend may be turning up. |
| Price crosses above the 200-day average | The same with the 200-day SMA. | Long-term trend change. Rare, slow signals. |
| Closes at a 20-day high (breakout) | Today’s close is above every close of the previous 20 sessions. | Momentum: strength tends to attract more buyers. |
| Breaks above an NR7 day’s high | Yesterday had the narrowest high-low range of the last 7 days, and today closes above yesterday’s high. | A quiet day (see NR7 stocks) followed by an upside break. |
| RSI(14) rises back above 30 | The 14-day RSI was at or below 30 yesterday and is above 30 today. | Mean reversion: buying when an oversold fall starts to turn (see RSI oversold stocks). |
| Gap up of 2% or more | Today’s open is at least 2% above yesterday’s close. | News or strong demand overnight. |
| Big-buyer day on an up close | Shares taken for delivery were at least 3× the stock’s median of the previous 50 sessions, with a normal or higher delivery %, and the price closed up. | Following unusual delivery buying (see Big money footprint). |
Exit rules (“Sell when”)
| Exit | How it works |
|---|---|
| Closes below the 20-day average | Sell at the next day’s open after a close under the 20-day SMA. Fast; many small exits. |
| Closes below the 50-day average | The same with the 50-day SMA. Slower; gives the trade more room. |
| Trailing stop | The stop follows the highest price since you bought, a fixed % below it (“Stop loss %”). Sold during the day if the price touches it. |
| Stop loss and target | A fixed stop below the buy price and a fixed profit level above it, both in %. Whichever is hit first. |
| After a fixed number of days | Sell at the open after “Hold days” sessions, whatever happens. |
How the trades are filled (this matters)
- Signals are judged on the close; trades happen at the next day’s open. You only know a close is above the average after the market shuts, so the tool buys the next morning. This avoids look-ahead bias (using information you would not have had in time).
- Stops and targets are filled during the day at your level. If the stock opens beyond your stop (a gap down), the fill is the worse opening price, as in real life.
- If a stop and a target are both touched on the same day, the tool assumes the stop came first: the cautious assumption.
- Costs (default 0.2%) are taken off every completed trade.
- A trade still open on the last day is valued at the latest close and marked “still open”.
Why backtest at all: advantages and limits
✅ Cheap lessons
Losing money on a rule in a backtest costs nothing. Losing it in the market costs real rupees.
✅ Removes memory bias
We remember the breakouts that flew and forget the ten that failed. The trade table remembers all of them.
✅ Shows the pain, not just the gain
The worst fall and the losing streaks tell you whether you could actually sit through the rule.
✅ A fair benchmark
Every result sits next to buy and hold. A rule is only interesting if it beat simply holding, or fell less.
The limits, honestly
- Two years, one stock. A stock’s last two years are one story. A rule can look brilliant because that story happened to suit it.
- Simple rules only. No short selling, no position sizing, no combining two stocks, no intraday data.
- Daily prices. The tool cannot know what happened inside the day except the open, high, low and close. Real fills, especially in thin stocks, can be worse.
- Before taxes. Short-term capital gains tax is not deducted.
- The past does not repeat on schedule. The next section shows, with numbers, how a rule that looked best in one year did in the next.
The three big traps: overfitting, costs and survivorship
1. Overfitting: the best-looking rule is usually luck
Overfitting means tuning a rule until it fits the past perfectly, so that it describes old noise rather than a real habit of the market. With 7 entries and 5 exits the tester already offers 35 combinations, and changing the stop, target or hold days multiplies that further. Try enough of them and one will always look excellent.
We checked this. For 12 large stocks (Reliance, HDFC Bank, Infosys, TCS, SBI, ITC, ICICI Bank, L&T, Bharti Airtel, Axis Bank, Maruti Suzuki and Sun Pharma) we split the data in two years. In year 1 (1 Nov 2024 to 3 Nov 2025) we picked, for each stock, the combination with the best result. Then we ran exactly that combination in year 2 (4 Nov 2025 to 6 Nov 2026), with the default 0.2% cost and default settings.
| Year 1 (chosen with hindsight) | Year 2 (the honest test) | |
|---|---|---|
| Median result of the “best” rule | +13.5% | −5.8% |
| Stocks where the rule made money | 12 of 12 | 4 of 12 |
| Stocks where it beat buy and hold | 10 of 12 | 6 of 12 (a coin toss) |
Median buy and hold in year 2 was −5.3%, so the “best” rules did about as well as doing nothing clever. Axis Bank’s best year-1 rule made +19.9%; in year 2 it lost 11.3% while the stock itself rose 7.9%.
What to do about it: keep rules simple and use the default settings unless you have a reason. Test the same rule on several stocks, not one. Distrust any rule that only works with one exact setting (for example a 7% stop but not 6% or 8%). Treat a backtest as a filter that rejects ideas, not a machine that discovers them.
2. Costs: small numbers that add up
Each trade pays brokerage, Securities Transaction Tax (STT), exchange charges, GST, stamp duty and, for delivery, a depository charge, plus slippage (buying a little higher and selling a little lower than the price you wanted). For delivery trades STT alone is 0.1% on the buy and 0.1% on the sell, so the tester’s default 0.2% per round trip is a floor, not a generous estimate. In smaller, less traded stocks slippage can be much larger.
A rule that trades often feels costs most. We tested “NR7 breakout, sell after 10 days” on the same 12 stocks (185 trades in two years):
| Cost per trade | 0% | 0.2% (default) | 0.5% |
|---|---|---|---|
| Median two-year result | +1.4% | −2.2% | −7.4% |
The same rule went from a small gain to a clear loss just by being honest about costs.
3. Survivorship: you are testing the winners
Survivorship bias means testing only the companies that are still around and doing well today. The tester can only load stocks that trade now; companies that were suspended, delisted or merged away are simply not there. And when you pick “well-known large caps” to test, you are picking companies that became large partly because their shares rose. Our own 12-stock list has this bias: it was chosen with today’s knowledge. Real traders in 2024 did not know which stocks would still be leaders in 2026.
Two smaller traps
- Corporate actions. The price data is adjusted for splits and bonuses, but not for every event. On 6 Jan 2025, the ITC Hotels demerger day, ITC opened at ₹455.60 against ₹481.60 the previous close, a 5.4% drop that was the hotel business leaving, not a loss. Buy and hold for ITC in the tester therefore looks worse than it was for a shareholder who kept the new shares.
- Too few trades. A rule with 5 trades and an 80% win rate has told you very little. One different trade changes the win rate by 20 points.
A tour of the strategy tester screen
Open the Strategy tester. It loads Reliance with “Price crosses above the 50-day average” and “Price closes below the 20-day average”. The page has four parts: the form, the summary numbers, the trade chart and the equity curve with the trade table.
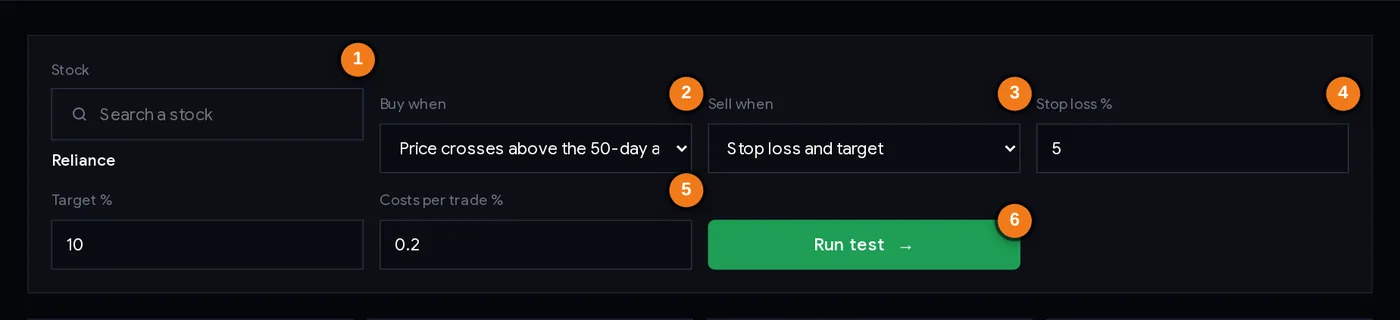
- 1Stock: search any NSE stock; the loaded name shows next to it.
- 2Buy when: the entry rule.
- 3Sell when: the exit rule.
- 4Stop loss % and Target %: shown only for exits that use them (Hold days appears for the fixed-days exit).
- 5Costs per trade %: deducted from every trade (default 0.2%).
- 6Run test: reruns the backtest (any change also reruns it).
The extra boxes change with the exit you choose: Stop loss % appears for the trailing stop and for stop-and-target, Target % only for stop-and-target, and Hold days only for the fixed-days exit. Changing any box reruns the test straight away; the Run test button does the same.
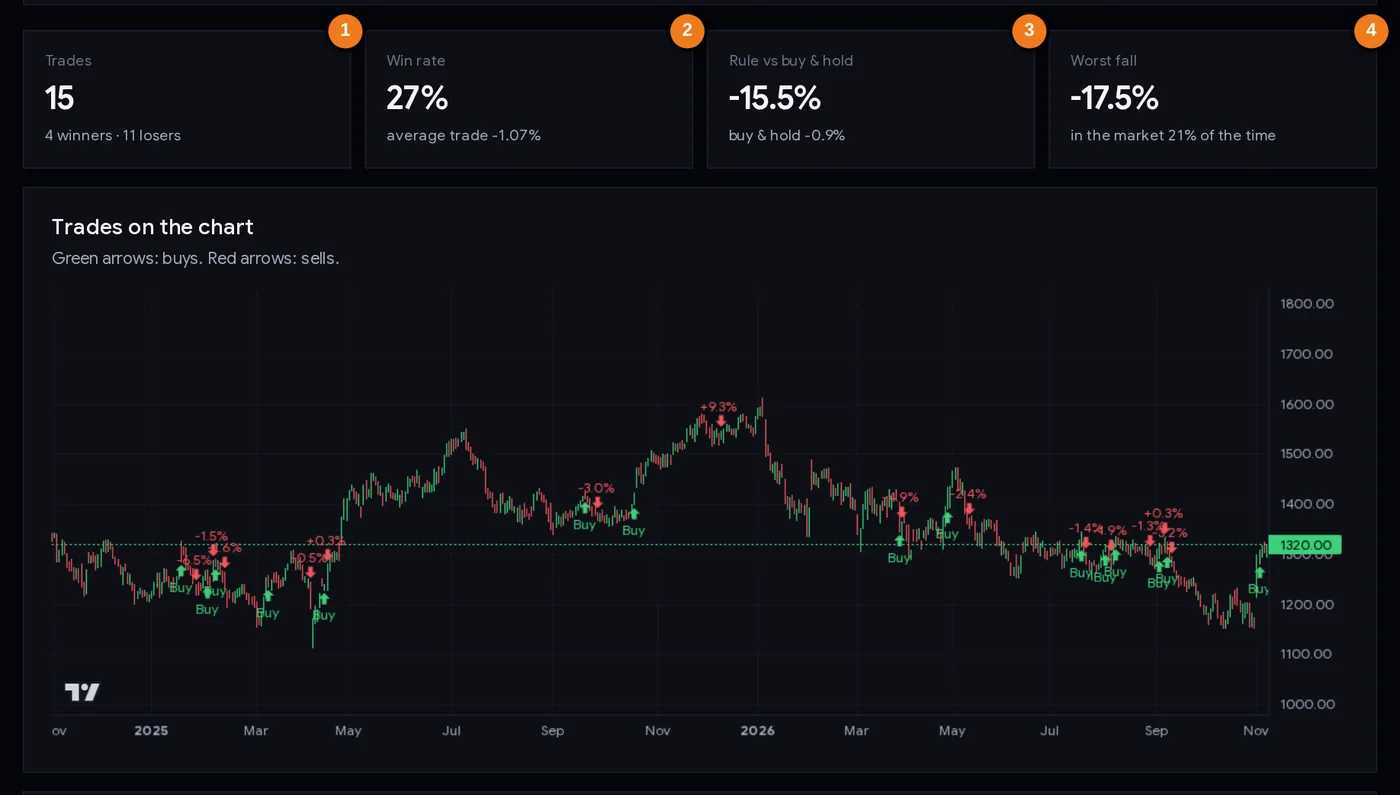
- 1Trades, winners and losers
- 2Win rate and average trade after costs
- 3The rule’s total return against buy and hold
- 4Worst fall (maximum drawdown) and time in the market
The four summary numbers
| Box | What it tells you |
|---|---|
| Trades | How many completed (and open) trades the rule took, split into winners and losers. Fewer than about 20 trades is a small sample. |
| Win rate | The share of trades that made money after costs, with the average trade underneath. A low win rate can still be fine if the winners are much bigger than the losers. |
| Rule vs buy & hold | The total return of the rule over the two years, against buying on the first day and holding. |
| Worst fall | The maximum drawdown of the rule’s equity curve: the biggest drop from a peak to a later low. Underneath: how much of the time your money was actually in the stock. |
On the candlestick chart, green arrows mark buys (on the day you bought, at the open) and red arrows mark sells, labelled with that trade’s result.
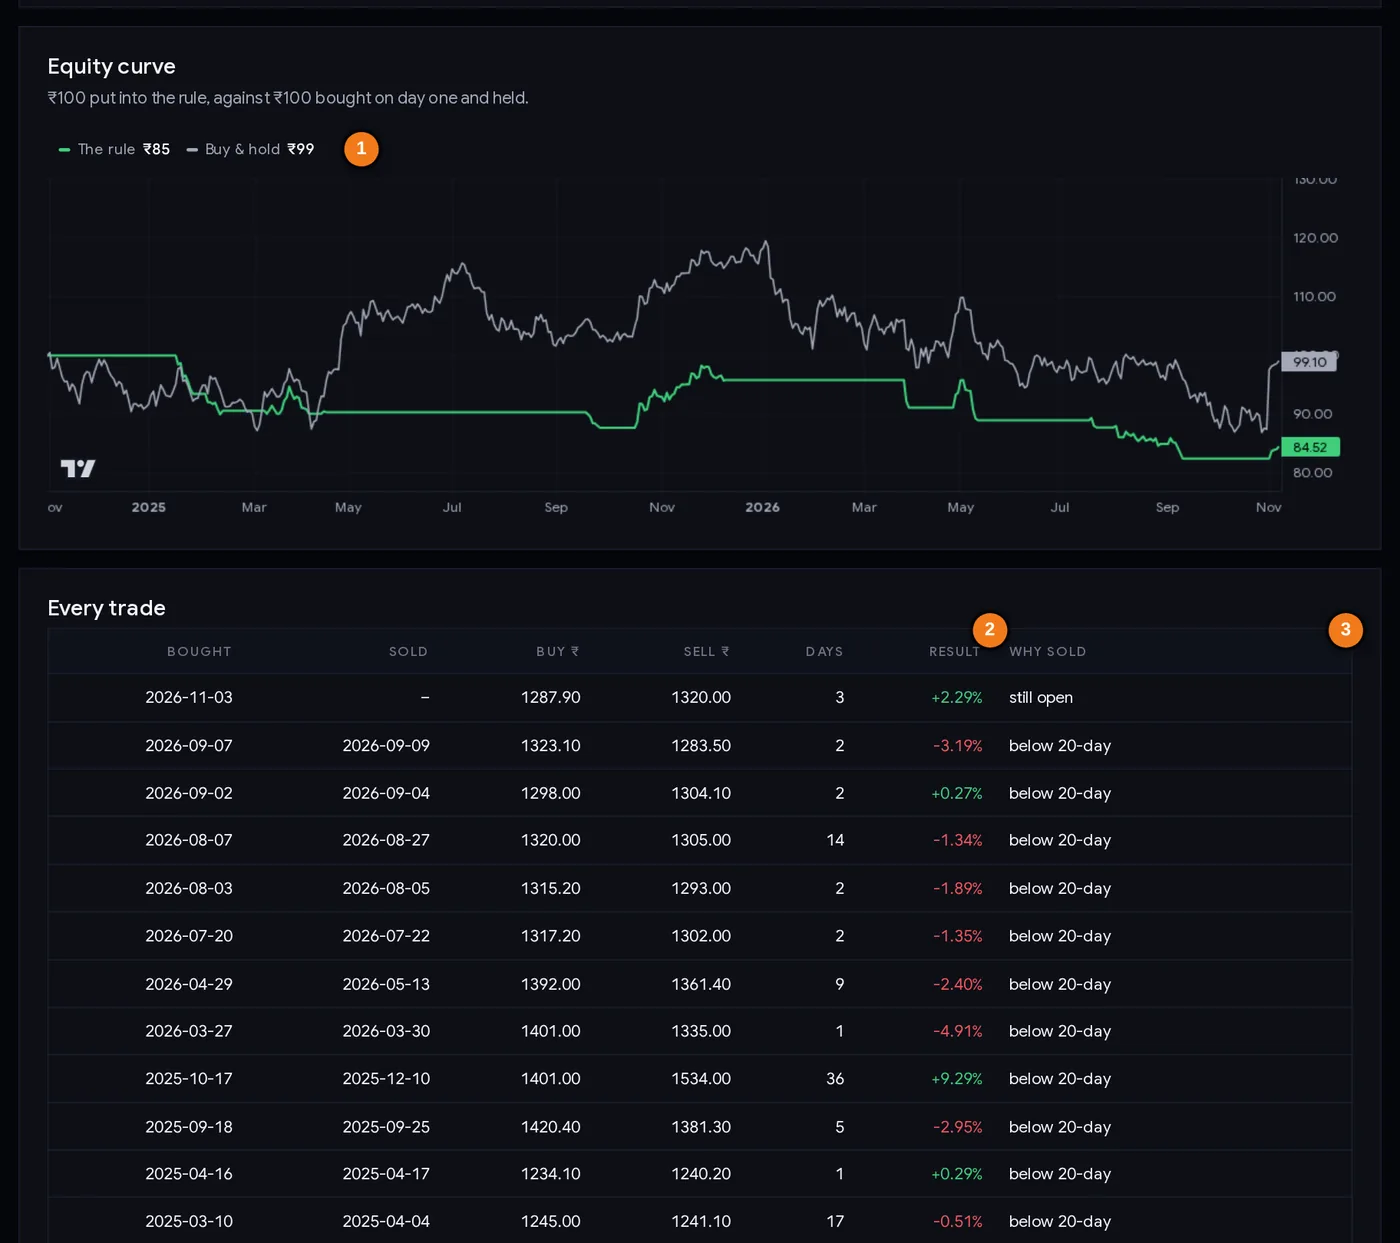
- 1Where ₹100 ended: the rule vs buy and hold
- 2Each trade’s result after costs
- 3Why the trade was sold
The equity curve and trade table
- Equity curve. The green line is ₹100 following the rule; the grey line is ₹100 bought and held. The legend shows where each ended. A rule that ends lower but with a much smaller worst fall may still suit a cautious trader; one that ends lower and falls as much is simply worse.
- Every trade. Newest first: date bought, date sold, buy and sell price in ₹, days held, result after costs, and why it was sold (below 20-day, stop, target, trailing stop, N days or still open). Click a column header to sort it.
The address bar keeps the stock you picked (for example ?s=reliance), so you can bookmark it.
Step by step: testing an idea properly (20 minutes)
- Write the idea in one sentence before you open the tool. For example: “Strong stocks that break to a 20-day high keep going for a while.” Decide now which entry and exit express it.
- Pick the stock with the search box. Start with a liquid stock you know.
- Choose the entry and exit that match your sentence. Leave the stop, target and hold days at their defaults the first time.
- Set an honest cost. 0.2% for liquid large caps; 0.4–0.5% or more for small, thinly traded stocks.
- Read the four boxes in this order: number of trades (enough?), rule vs buy and hold (better?), worst fall (bearable?), win rate (what it feels like).
- Open the trade table. Is the result carried by one or two big trades? If you remove the best trade, is anything left?
- Look at the chart. Did the rule buy in choppy sideways stretches again and again? That is where trend rules lose.
- Repeat on 4–5 other stocks without changing anything. A real edge should show up, at least weakly, on most of them.
- Only then try one change (for example a different exit), and check that nearby settings give similar results.
- Write down what you learned, including “this did not work”. That is a useful result.
Three ways traders use the tester
Playbook A: the idea filter
Before trading a new setup from a scanner (a 20-day breakout, an NR7 break, an RSI bounce), run it on the stock you are watching and on a few similar stocks. If the rule lost money after costs on most of them over two years, you have saved yourself from trading a weak idea. If it held up, you still trade it small, with a stop, and keep a record.
Playbook B: choosing an exit you can live with
Keep the entry fixed and compare exits. A tight exit (20-day average, or a small trailing stop) gives many small losses and few long rides; a loose one (50-day average) gives fewer trades but bigger drawdowns. Look at the worst fall and the longest losing run in the table and ask honestly which one you would follow in real time. The best rule on paper is useless if you abandon it after five losses.
Playbook C: does timing beat holding for this stock?
Compare the rule’s worst fall with buy and hold’s. For Reliance over the two years to 6 Nov 2026, the 50-day/20-day rule fell at most 17.5% while holding the stock fell as much as 27.3%, but the rule ended at −15.5% against −0.9% for holding. Less pain, but a worse result. That trade-off is the real decision, and only you can make it.
Risk comes first. Whatever the backtest says, decide the most you will lose on one trade (for example 0.5–1% of your capital), place a stop loss, and size the position with the position size calculator.
Case studies from the tester (data to 6 Nov 2026)
All numbers below were produced by the tester’s own rules on its own data (two years of daily NSE prices, 31 Oct 2024 to 6 Nov 2026), with the default 0.2% cost unless stated.
1. Reliance with the default rule: whipsaws
Buy on a cross above the 50-day average, sell on a close below the 20-day average. The rule took 15 trades: 4 winners and 11 losers, a 27% win rate, average trade −1.07%. ₹100 became ₹85 (−15.5%) while buy and hold ended at ₹99 (−0.9%). The rule was in the market only 21% of the time.
One trade did what the rule hopes for: bought at ₹1,401 on 17 Oct 2025 and sold at ₹1,534 on 10 Dec 2025, +9.3%. Most of the rest were short stays of 1–9 days that ended a few percent lower, because Reliance spent long stretches moving sideways around its averages. Lesson: trend rules need trends; in a range they bleed through small losses and costs.
2. The “best” rule for Reliance: an overfitting lesson
Out of the 35 entry and exit combinations, the best two-year result for Reliance came from “RSI(14) rises back above 30, sell after 10 days”: +13.3% from only 5 trades (80% win rate) against −0.9% for holding. It looks like a discovery. We then ran the same rule, unchanged, on 11 other large caps. It made money on some (TCS +17.8% while the stock fell 37.0%), but on Axis Bank it returned −9.2% while the stock rose 14.1%, on Maruti Suzuki −11.9% against +15.1%, and on Bharti Airtel −0.6% against +30.7%. Lesson: five trades on one stock is a story, not evidence. In rising stocks, a rule that sits in cash most of the time usually lags.
3. The year-split test
As described above: rules chosen as the best for each of 12 stocks in year 1 (median +13.5%) produced a median of −5.8% in year 2, with 4 of 12 positive. Lesson: judge a rule on data it was not chosen on.
4. Costs turn a small edge into a loss
“NR7 breakout, sell after 10 days” on the 12 stocks: 185 trades, median result +1.4% with zero cost, −2.2% at 0.2% and −7.4% at 0.5%. Lesson: the more a rule trades, the more an honest cost matters.
Common mistakes
- Trying settings until the number looks good. That is overfitting. The more you try, the less the best result means.
- Setting costs to zero. Real trading always has costs; 0.2% is a minimum for delivery trades.
- Ignoring buy and hold. A rule that made +10% while the stock made +30% has failed.
- Trusting a high win rate from a handful of trades. Look at the number of trades first.
- Testing only stocks that went up a lot. Of course buying them worked. Test on stocks that fell or went sideways too.
- Forgetting the worst fall. A rule with a 35% drawdown will test your nerves in a way the final number hides.
- Treating the result as a forecast. The next two years will not be a copy of the last two.
- Trading the rule full size straight away. Start small, keep a log, compare your real results with the backtest.
Backtest checklist
- The idea was written down before testing, and the rule matches it.
- Costs are set honestly (0.2% or more; higher for small, illiquid stocks).
- At least about 20 trades, or you accept the result is only a hint.
- The rule beat buy and hold, or fell clearly less; you know which.
- The result is not carried by one or two trades.
- It held up on 4–5 other stocks with the same settings.
- Nearby settings (a slightly different stop or hold period) give similar results.
- You could live with the worst fall and the longest losing run.
- Stop loss and position size are planned before any real trade.
Glossary
| Backtest | Replaying a trading rule on past prices to see how it would have behaved. |
| Entry / exit rule | The conditions for buying and for selling. |
| SMA | Simple moving average: the average closing price of the last N days. |
| RSI(14) | Relative Strength Index over 14 days, from 0 to 100; below 30 is usually called oversold. |
| NR7 | A day whose high-low range is the narrowest of the last 7 days. |
| Equity curve | How the money in the rule grew or shrank over time. |
| Buy and hold | Buying on the first day and doing nothing; the benchmark for any rule. |
| Win rate | The share of trades that made money after costs. |
| Maximum drawdown (worst fall) | The biggest drop from a peak to a later low. |
| Trailing stop | A stop that rises with the highest price since entry. |
| Slippage | The difference between the price you wanted and the price you got. |
| Overfitting | Tuning a rule so closely to past data that it fits noise and fails on new data. |
| Look-ahead bias | Accidentally using information in a test that was not available at the time. |
| Survivorship bias | Testing only the companies that still exist and did well, which flatters results. |
Questions
What is backtesting in the stock market?
Backtesting means applying a trading rule to past prices to see what trades it would have taken and what the result would have been. It helps you reject weak ideas cheaply. It cannot tell you what will happen next, because markets change and a rule can fit the past by chance.
How does the ChartMine strategy tester calculate results?
It replays two years of a stock’s daily NSE prices (adjusted for splits and bonuses). When the entry condition appears on a close, it buys at the next day’s open; it sells at the next open after an exit signal, or during the day at your stop or target level. Your cost per trade is deducted from every trade, and the result is compared with buy and hold.
Is a profitable backtest a good strategy?
Not necessarily. In our test on 12 large NSE stocks, rules chosen as the best in one year had a median result of −5.8% in the next year. Check the number of trades, costs, the result on other stocks and nearby settings before trusting any backtest.
What cost per trade should I use in a backtest?
For delivery trades in liquid large caps, 0.2% per round trip is a realistic minimum, because STT alone is 0.1% on the buy and 0.1% on the sell. Add more for small or thinly traded stocks, where slippage is larger.
What is overfitting in trading?
Overfitting is tuning a rule until it matches past data so closely that it captures random noise. Such a rule looks excellent in the backtest and usually disappoints in real trading. Simple rules, default settings and testing on several stocks reduce the risk.
What is survivorship bias in backtesting?
It is the error of testing only companies that still exist and did well. Stocks that were delisted or collapsed are missing from today’s lists, so tests on current large caps look better than what a trader could really have achieved.
Can I test short selling or intraday strategies?
No. The strategy tester tests long trades on daily candles only: buy first, sell later, one position at a time.